

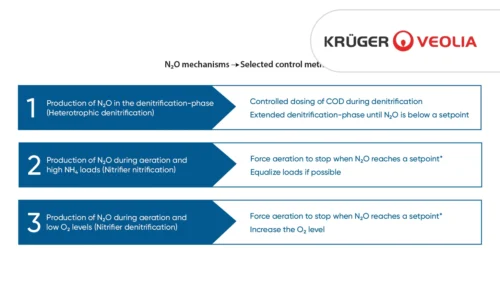
N2O Produced in Denitrification
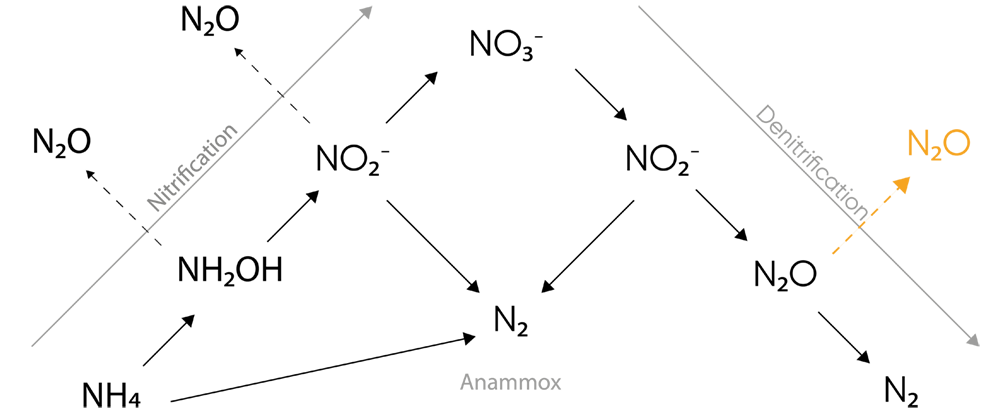
Full biological nitrogen removal in wastewater is achieved through a combination of nitrification and denitrification. N2O is an obligate intermediate in denitrification where a lack of carbon source will stop the process prematurely.
Optimizing Economy and Environmental Footprint
Incomplete denitrification is a source of N2O emissions, while a well operated denitrification can significantly reduce a WWTP’s emissions.
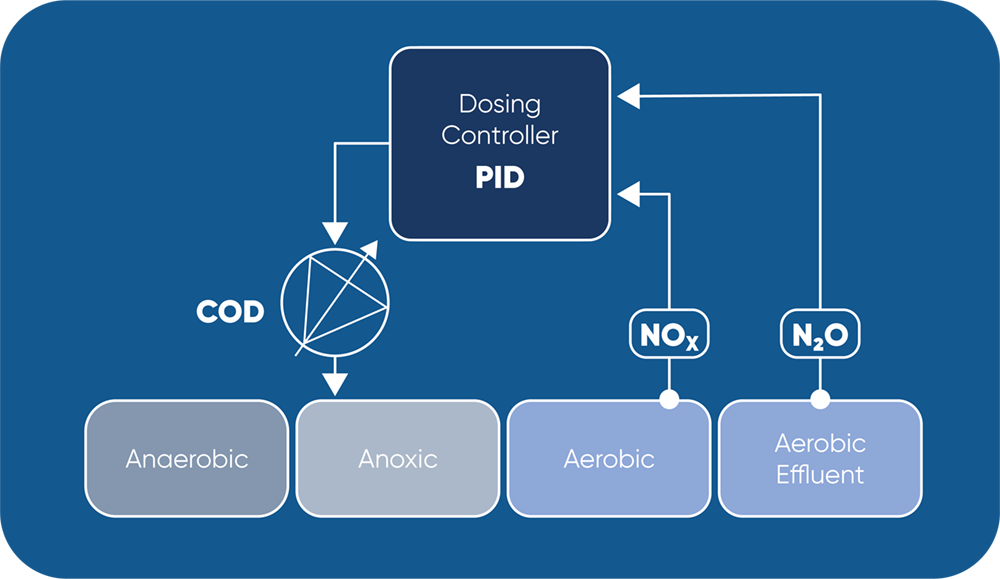
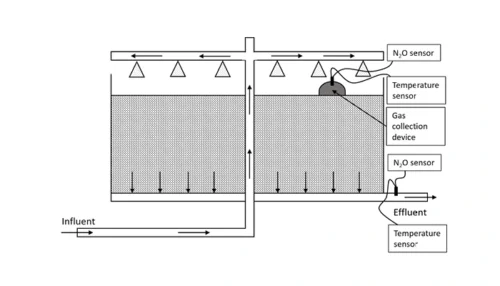
By using NOx-triggered and N2O-limited carbon dosing (as in schematic above), operators can ensure optimal use of external carbon source and achieve significant financial savings while ensuring tight effluent control.
Case Study: N2O Wastewater Sensor as Tool for Carbon Dosage Control
Dosage of external carbon source is a common method to enhance denitrification, especially on sites with very low N-limits in their effluent. In practice the amount of carbon is often not based on real time measurements, leading to regular overdosing.
The amount of carbon available relative to nitrogen to denitrifying bacteria limits their ability to complete the last step of denitrification and to produce N2 from N2O (Fig 1).
The connection between carbon dosage and nitrous oxide
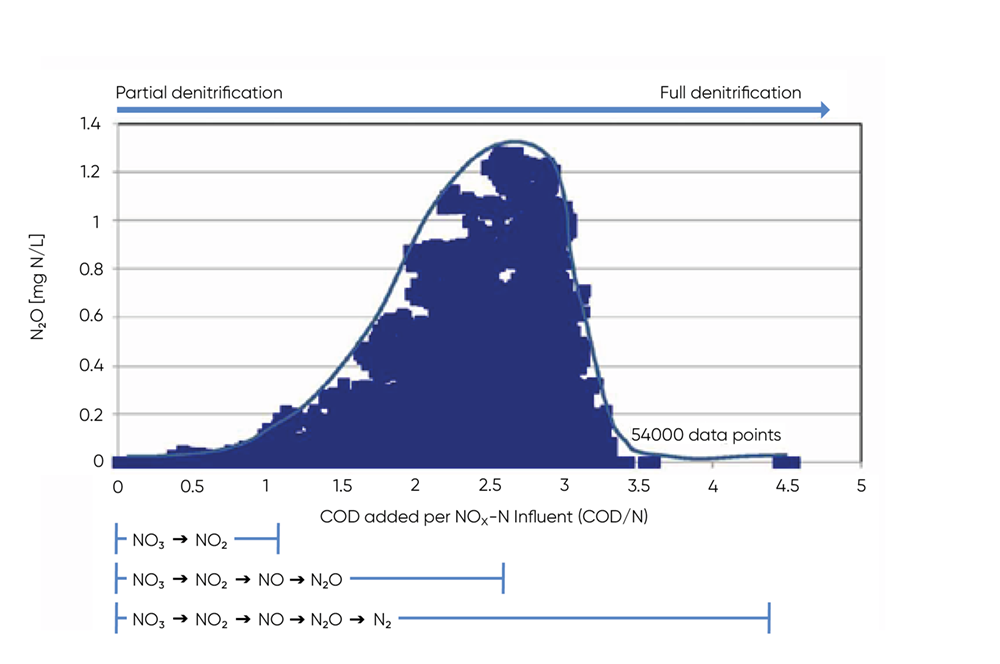
Applied research has shown that a low COD/N ratio can lead to increased N2O production and that a ratio below 3.5 can lead to significant N2O emissions.
Figure 2 demonstrates the relationship between COD/N and N2O. The bell-shaped relationship between N2O and COD/N makes it possible to avoid excessive N2O emission by aiming for either a high (>3.5) or a low (<1) COD/N ratio.
From a process control standpoint, the slope of the N2O curve in response to the different COD/N-ratios can be used as an indicator for the dominating sludge process. If aiming at complete denitrification to N2, the N2O sensor can be applied to monitor N2O concentration and increase the carbon load when the N2O concentration is increasing to ensure a COD/N ratio above 3.5. Once N2O falls under a given setpoint, carbon dosing can again be stopped, ensuring optimal process efficiency and resource use.
N2O sensor feedback prevents carbon overdosing
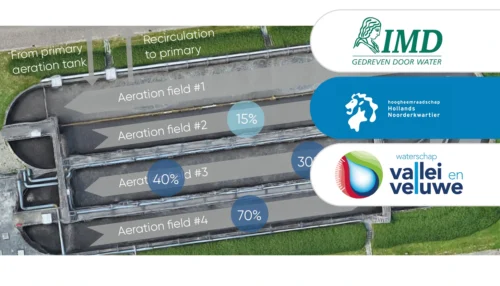
Andalib et al. 2017 demonstrated the carbon dosage automation in full scale at four American wastewater treatment plants. The researchers applied real-time control of carbon dosing based on NOx and N2O sensors.
The study showed that nitrogen oxide (NOx) probes of both UV and ISE types alone were less dependable when concentrations fell below 1-1.5mg/L, leading to an overdosing of carbon source.
By using the N2O sensor as feedback parameter, the WWTPs avoided overdosing, resulting in high potential savings – both financially and in terms of greenhouse gas emissions.
Two liquid phase N2O sensors accurately represent process dynamics and emissions in most common raceway and recirculation reactors.
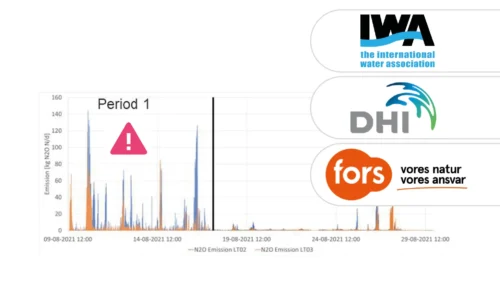
Learn how Kerteminde Forsyning applied nitrous oxide data to reduce the formation of N2O while maintaining low nitrogen emissions
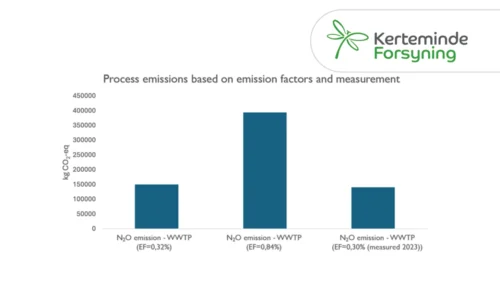
Case Study: Full-scale comparison of N2O emissions determined by liquid sensors and off-gas measurement
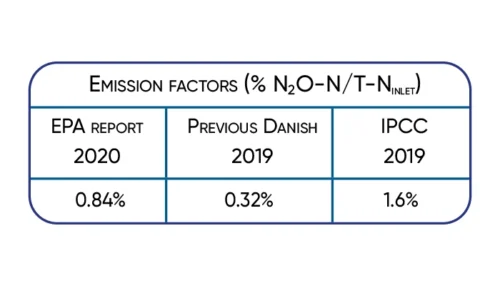
Significant 3-fold increase in IPCC2019 wastewater N2O emission factor supported by Danish studies.
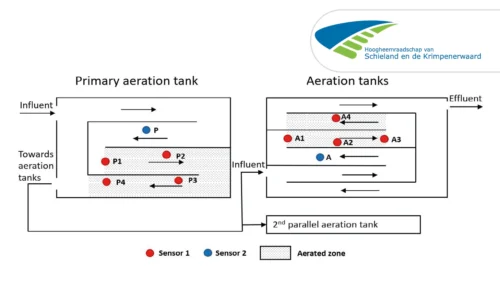
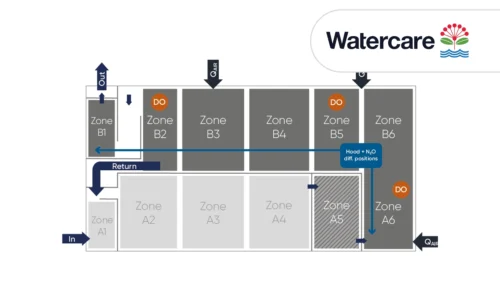
A case study from Kralingseveer WWTP in the Netherlands explores the influence of sensor placement.
Based on data from Danish WWTPs through advanced online-control.
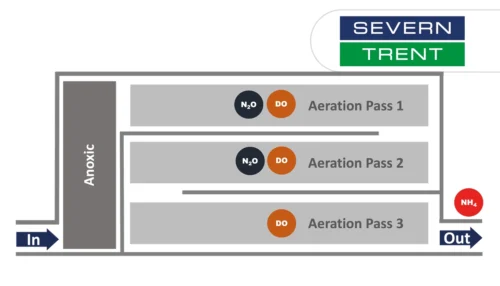
Learn about the results from N2O monitoring in the activated sludge tanks at Severn Trent’s Spernal sewage treatment plant
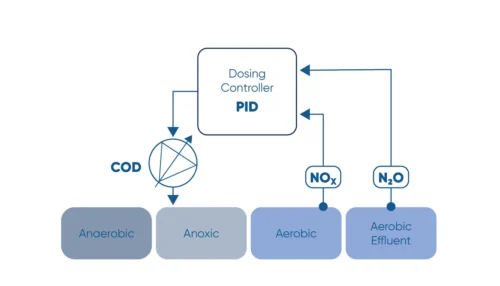
Monitor the N2O concentration in the liquid and use N2O as a control parameter for carbon dosage in the denitrification process.
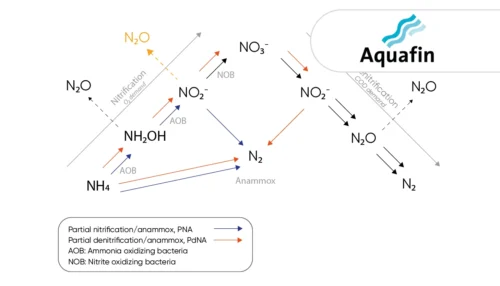
Learn how the water utility Aquafin controls emissions from deammonification processes using the the N2O Wastewater Sensor

Greenhouse gas emissions at wastewater treatment plants are coming into focus as the water industry works to reduce its climate footprint
The investment costs had initially deterred us somewhat. However ...
A study of three very different WWTPs in Denmark: Bjergmarken (125,000 PE), Holbæk (60,000 PE), and Hvalsø (11,570 PE)
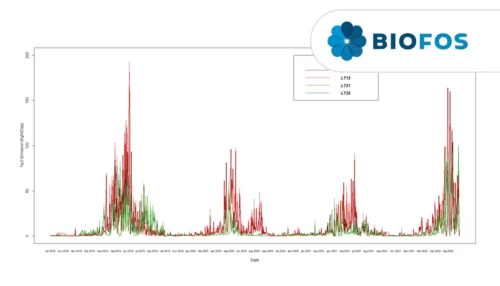
The available data show that the nitrous oxide emission varies in time and between wastewater treatment plants.
Information regarding N2O emissions from trickling filters is limited, partly caused by the difficulties in capturing off-gases.
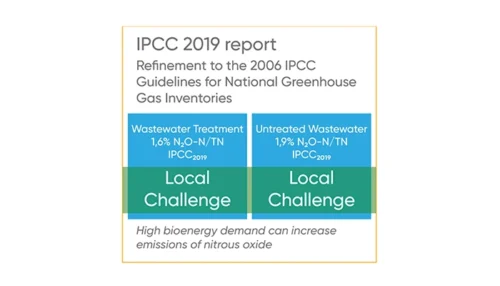
Significant 3-fold increase in IPCC2019 wastewater N2O emission factor supported by Danish studies.