
Methods
A measuring campaign was conducted to monitor N2O emissions from three different WWTPs managed by the same utility (Fors A/S, Denmark)
When: June to September 2021 for a period of 14 days in each WWTPs
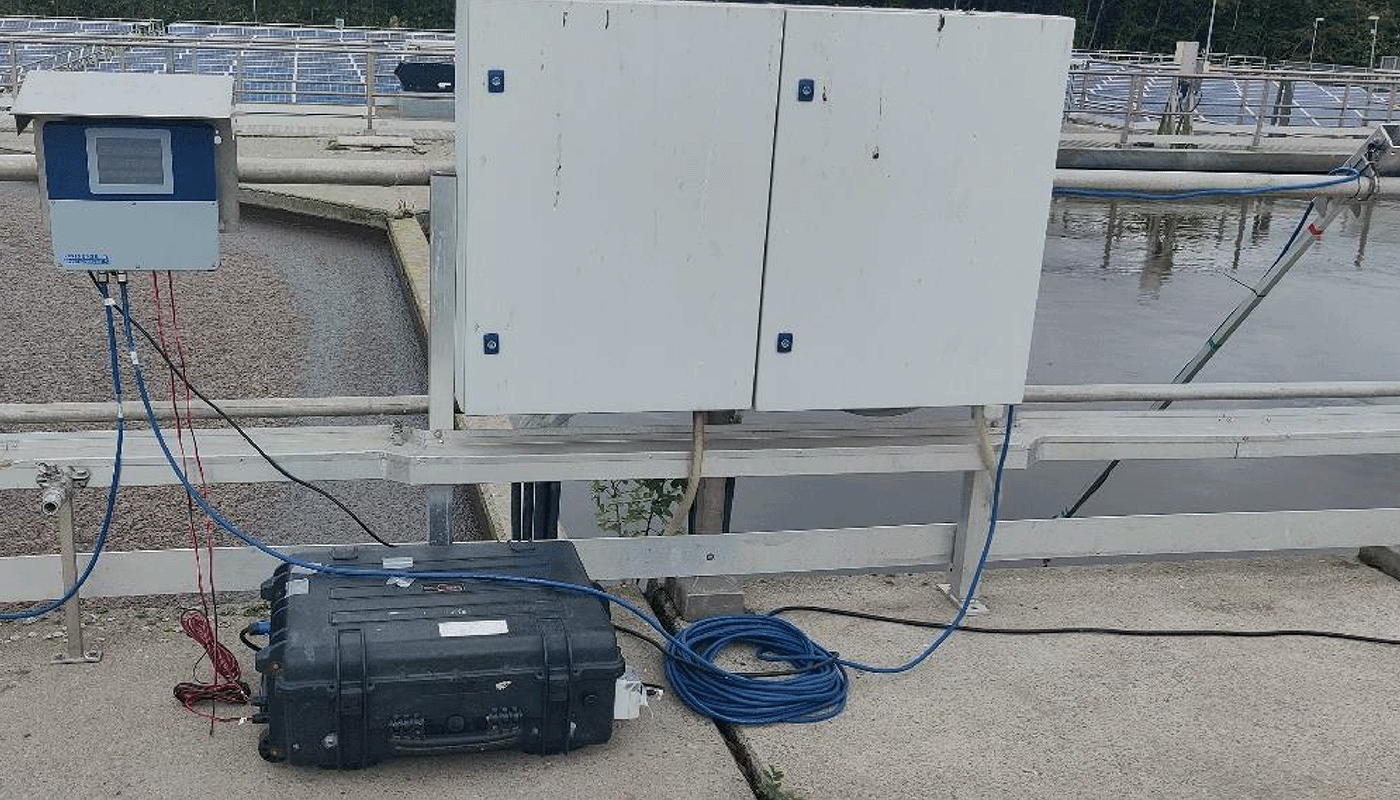
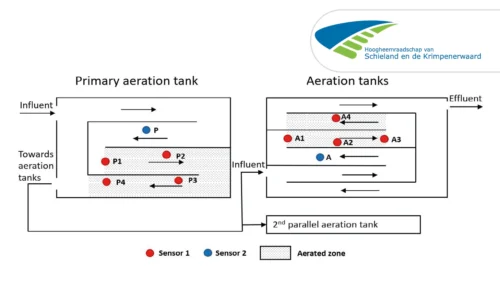
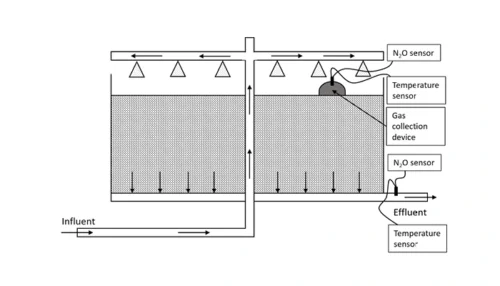
How: Two N2O Wastewater Sensors from Unisense Environment were used to measure N2O concentrations in the water phase and emissions to the gas phase were estimated based on the supplier’s recommendations. A transportable sensor setup was employed, with a monitoring suitcase containing a mini pc that could be accessed remotely (Figure 1). Data was collected and stored in DIMS CORE (DHI A/S, Denmark) installed on the mini pc to avoid setup in SCADA. N2O emissions were monitored in three municipal WWTPs.
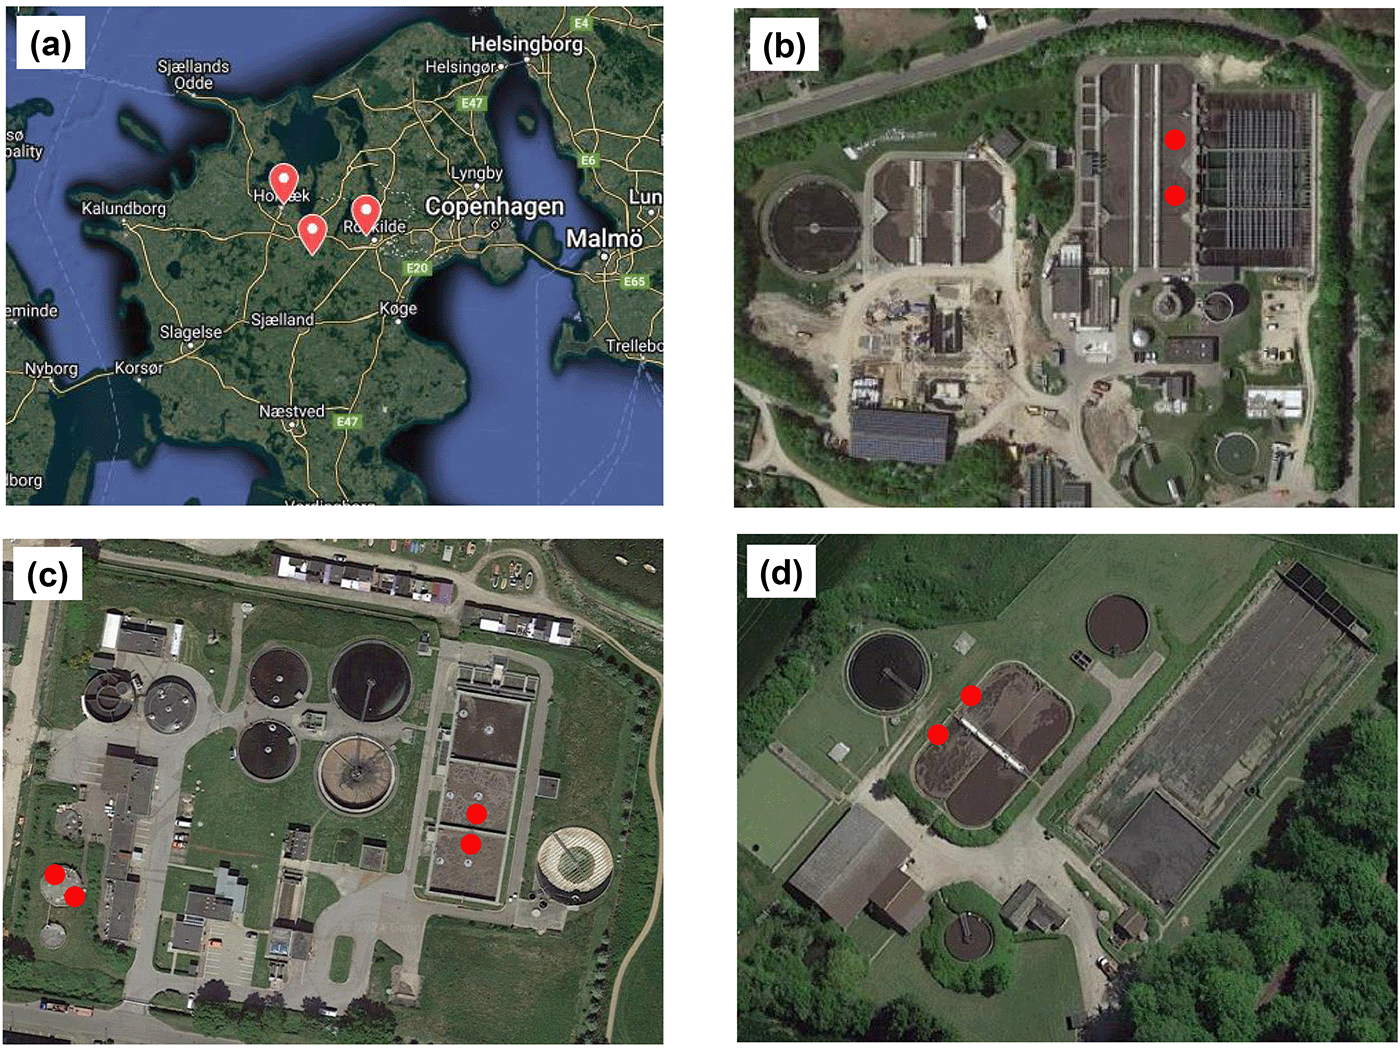
Where (Figure 2):
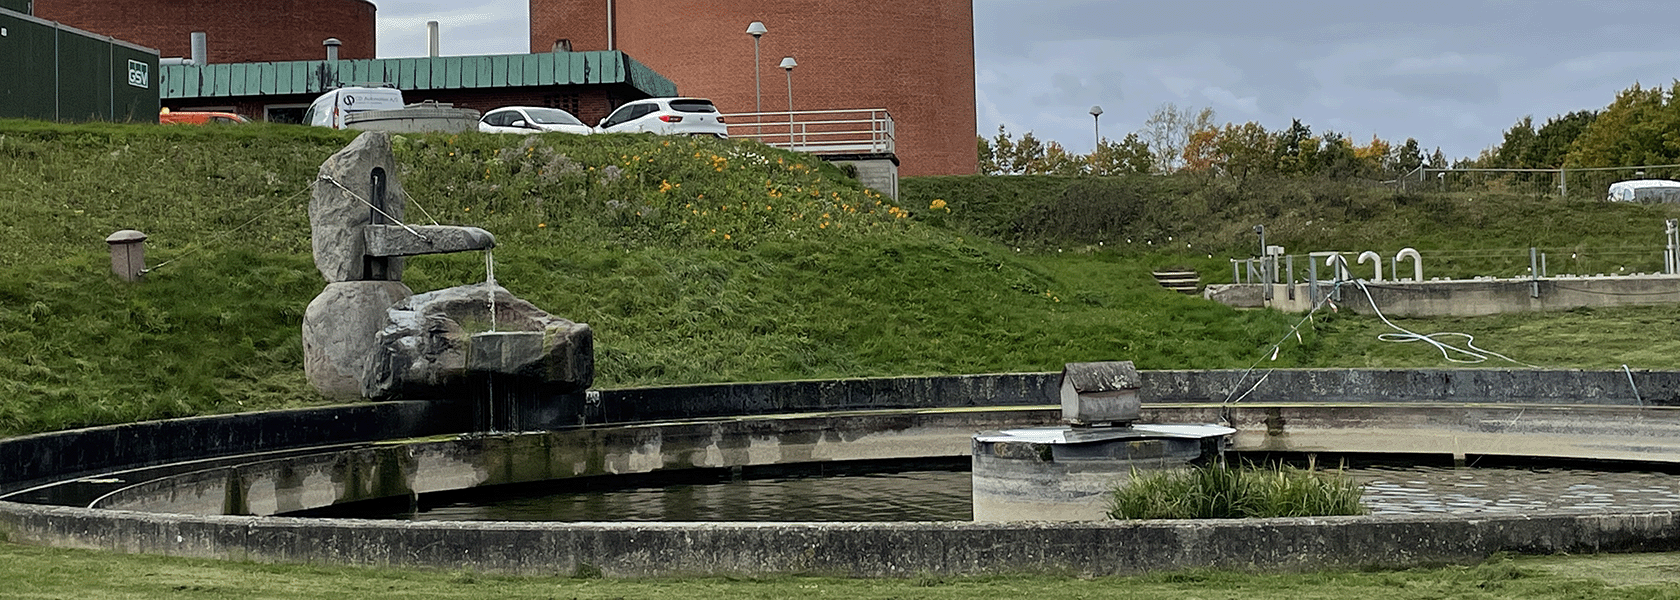
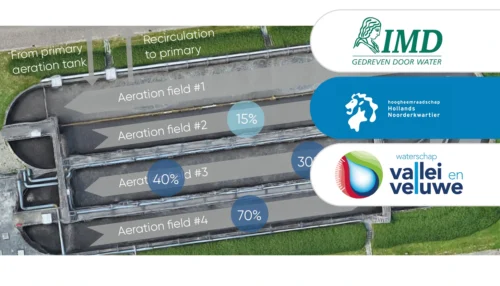
- Bjergmarken WWTP (125,000 PE) includes biological treatment with BioDeniphoTM configuration. N2O sensors were placed in two aerated tanks (LT2 and LT3) of parallel lines.
- Holbæk WWTP (60,000 PE) includes five parallel treatment lines operated in sequencing-batch reactor (SBR) mode with alternating anoxic and aerated phases and sidestream treatment of reject water with ANITATM Mox. N2O sensors were placed in two parallel sequencing batch reactors (SBR4 and SBR5) and in the ANITATM Mox reactor.
- Hvalsø WWTP (11,570 PE) and includes biological treatment with pre-denitrification and nitrification, whereby oxygen is supplied through surface aerators. N2O sensors were placed before and after surface aerators.
Results & Discussion
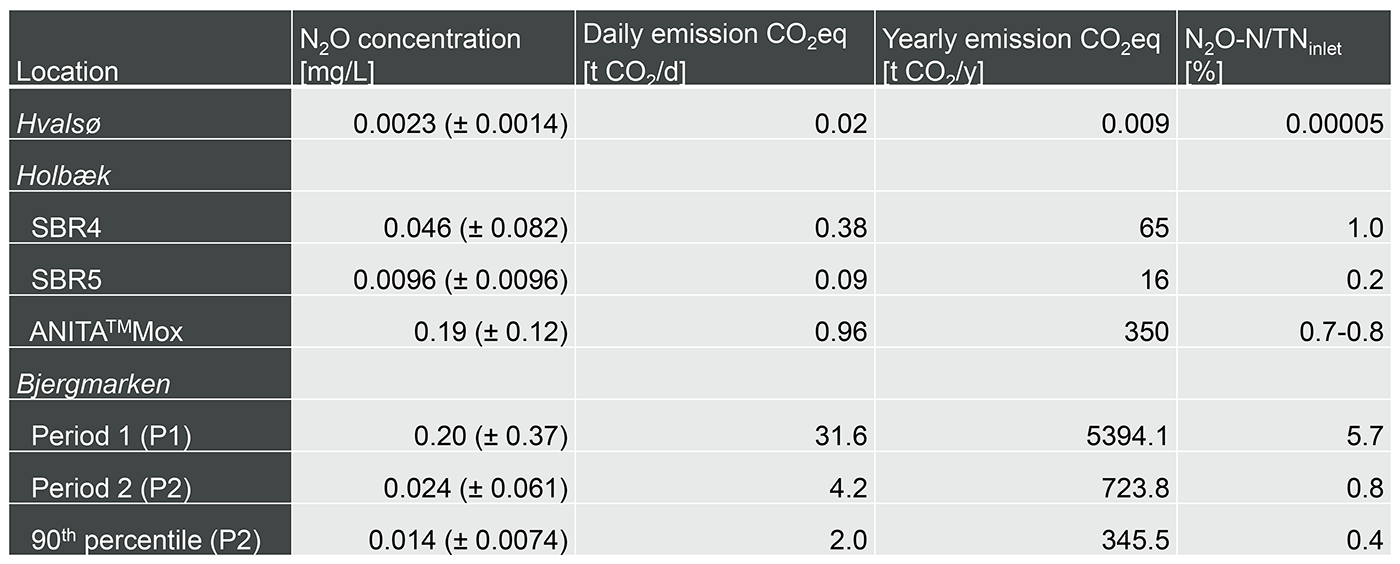
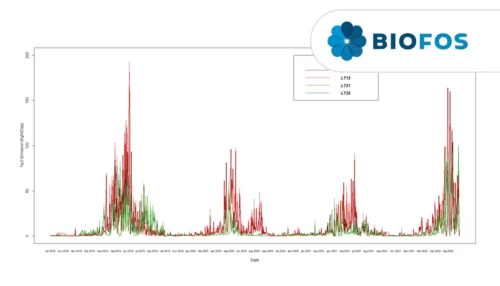
Bjergmarken WWTP
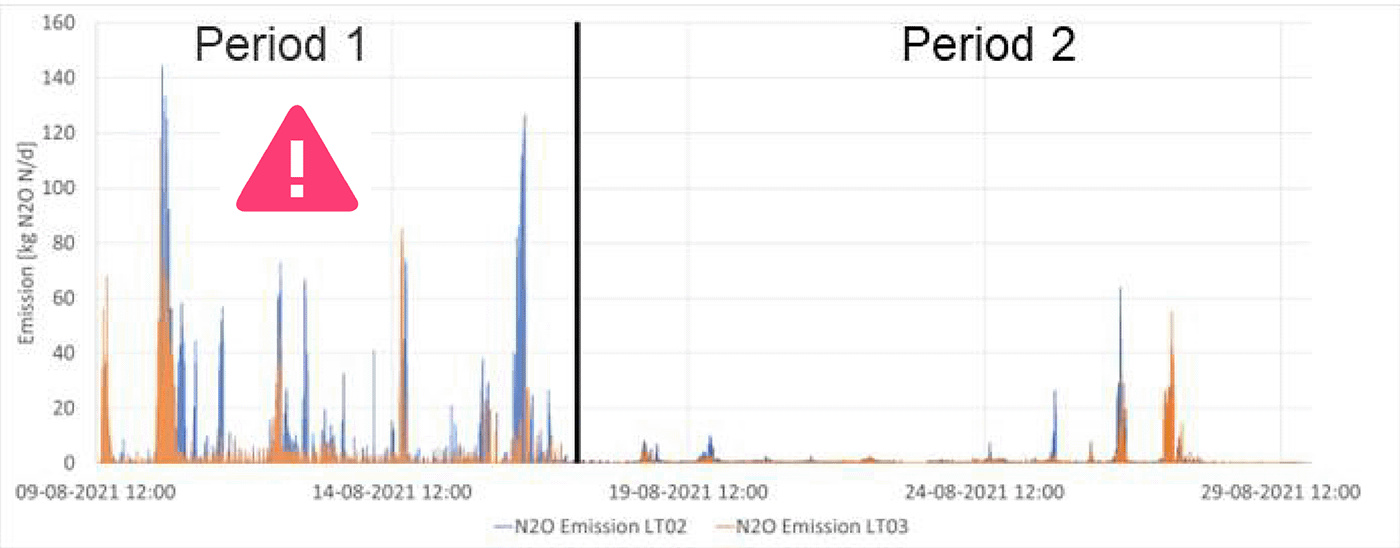
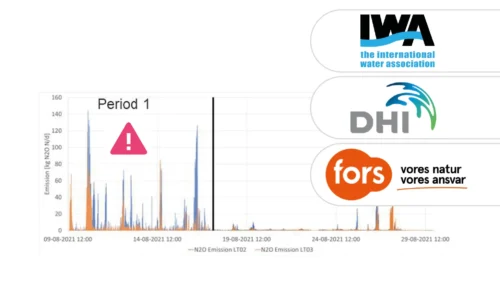
High variability in N2O emissions was observed during the monitoring campaign (Figure 3). Very high N2O emissions were measured in the first part of the monitoring campaign and were associated to temporary changes in process operation (namely inlet pumping, and aeration set points). After stable operation was achieved, short periods of elevated N2O emissions could still be detected. Overall, elevated emissions were observed in less than 10 of the monitoring time, leading to significant differences in emission factors calculated by considering (0.8% N2O-N/N removed) and neglecting (0.4%) unusually high emissions.
Holbæk WWTP
N2O emissions in the two SBR tanks differed by a factor 4. Phase length can result in uneven load concentrations in the tanks and can thus lead to diverting N2O emissions. Strategies of load equalization could minimize emissions. Interestingly, low N2O emissions from ANITATM Mox were observed (0.7-0.8%) as compared to other reject water treatment systems (e.g., 5.5% for DEMON). Continuous aeration and inflow, together with the use of biofilm systems, can be thus hypothesized as strategies for emission reduction in sidestream treatment.
Hvalsø WWTP
Monitoring results indicated considerably low N2O emissions (0.00005% N2O-N/N removed). This observation is of relevance to assess strategies supporting centralized treatment in medium and large sized WWTPs.
The overall results from the monitoring campaign, including calculated N2O emission factors for main and sidestream processes in the three WWTPs, are summarized in Table 1.
Two liquid phase N2O sensors accurately represent process dynamics and emissions in most common raceway and recirculation reactors.
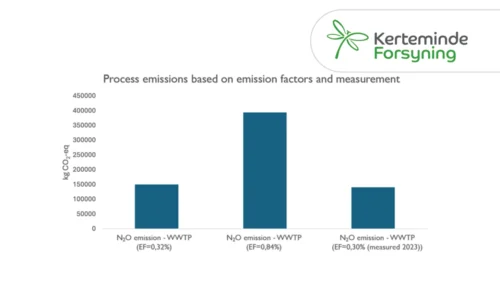
Learn how Kerteminde Forsyning applied nitrous oxide data to reduce the formation of N2O while maintaining low nitrogen emissions
Case Study: Full-scale comparison of N2O emissions determined by liquid sensors and off-gas measurement
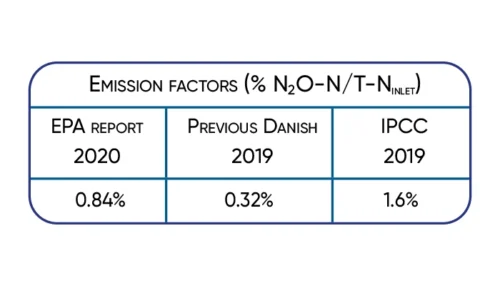
Significant 3-fold increase in IPCC2019 wastewater N2O emission factor supported by Danish studies.
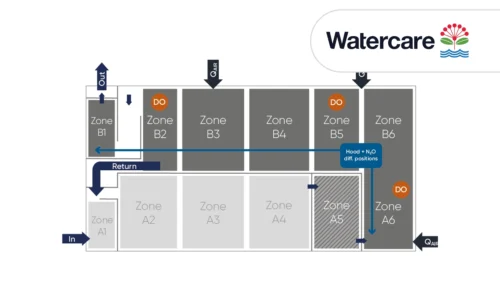
A case study from Kralingseveer WWTP in the Netherlands explores the influence of sensor placement.
Based on data from Danish WWTPs through advanced online-control.
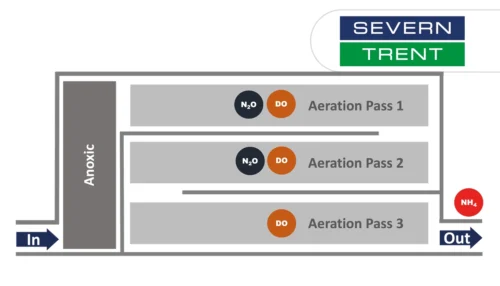
Learn about the results from N2O monitoring in the activated sludge tanks at Severn Trent’s Spernal sewage treatment plant
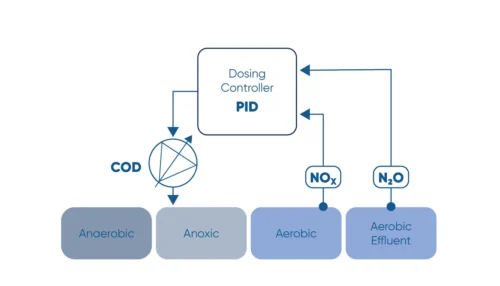
Monitor the N2O concentration in the liquid and use N2O as a control parameter for carbon dosage in the denitrification process.
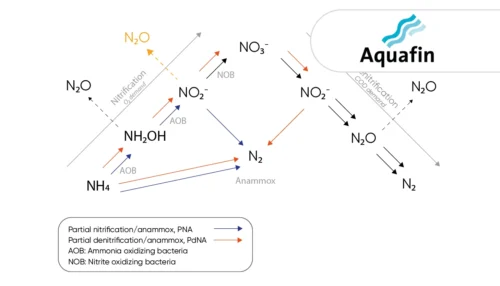
Learn how the water utility Aquafin controls emissions from deammonification processes using the the N2O Wastewater Sensor
Greenhouse gas emissions at wastewater treatment plants are coming into focus as the water industry works to reduce its climate footprint

The investment costs had initially deterred us somewhat. However ...
A study of three very different WWTPs in Denmark: Bjergmarken (125,000 PE), Holbæk (60,000 PE), and Hvalsø (11,570 PE)
The available data show that the nitrous oxide emission varies in time and between wastewater treatment plants.
Information regarding N2O emissions from trickling filters is limited, partly caused by the difficulties in capturing off-gases.
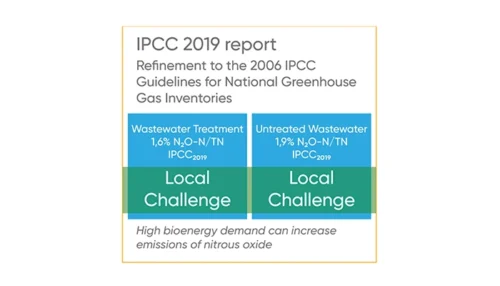
Significant 3-fold increase in IPCC2019 wastewater N2O emission factor supported by Danish studies.