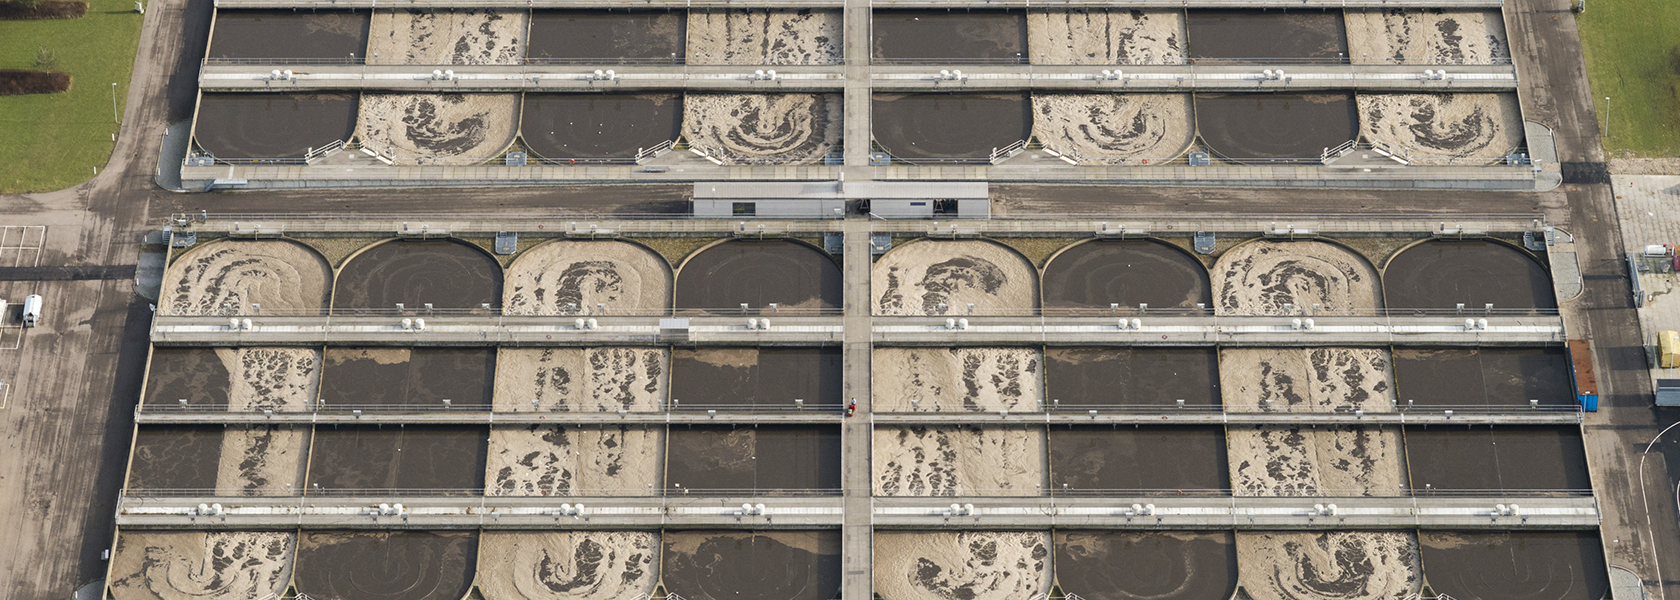

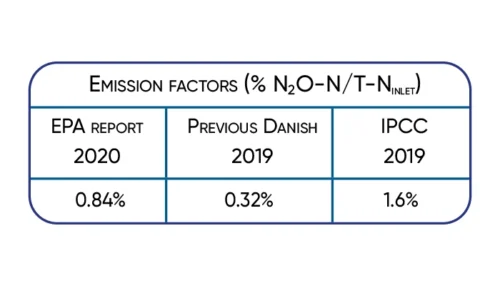
Wastewater treatment plants (WWTPs) contribute significantly to the global greenhouse gas stock through the production and emission of nitrous oxide (N2O). The more than 3-fold increase of the wastewater N2O emission factor by IPCC2019 underlines this.
Nitrous oxide emission constitutes about 42% of the CO2 footprint from Danish WWTPs. This goes to demonstrate that earlier years underestimation of the impact of N2O and the importance of control strategies targeted at understanding and reducing N2O emissions from WWTPs.
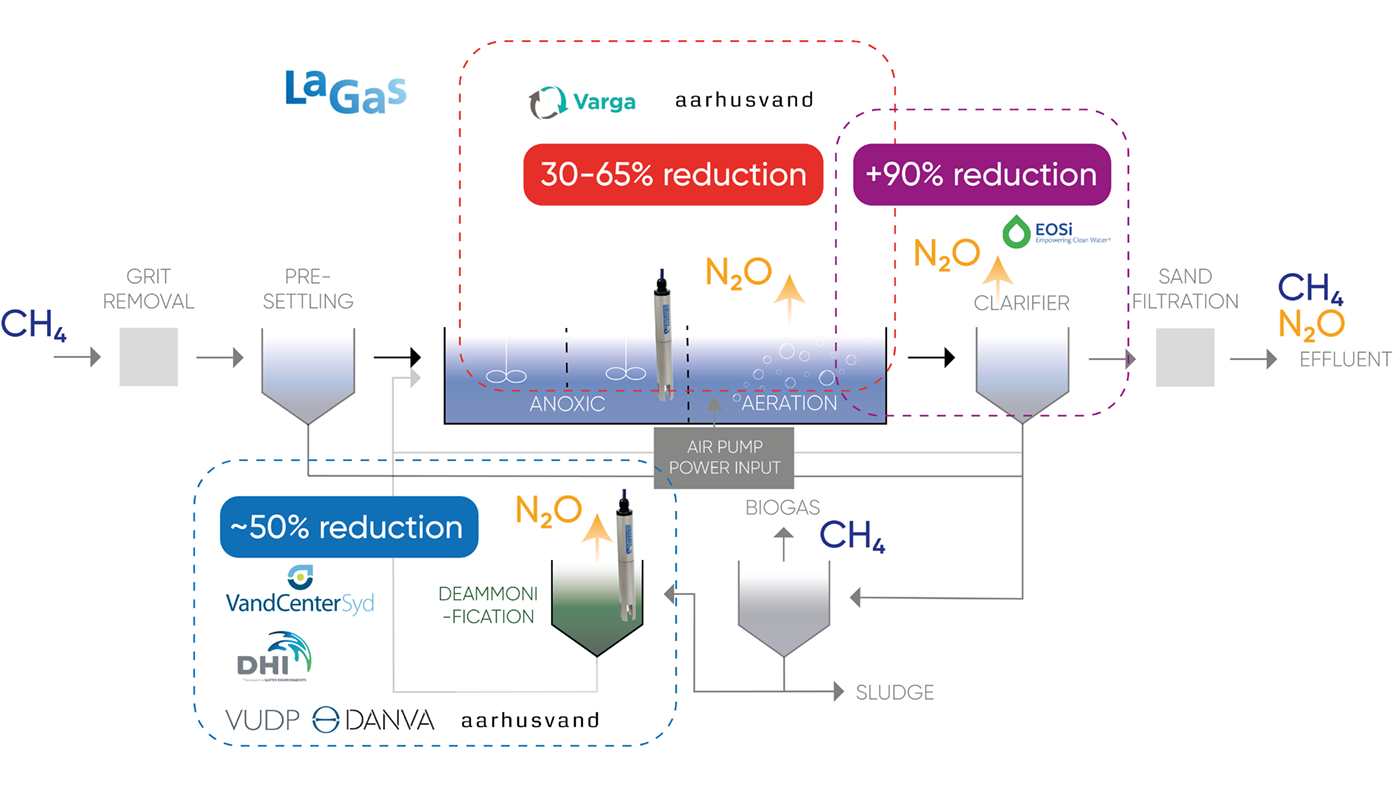
Danish studies support the increased IPCC2019 wastewater N2O emission factor. The studies also highlight the large temporal and WWTP site variations. In the VARGA study, N2O emission control has shown a potential CO2 footprint reduction up to 65%. Other WWTP sites show lower N2O emission. Overall, Danish WWTPs expect a to potentially reduce their CO2 footprint by 50% . This number will increase with the new IPCC2019 wastewater N2O emission factor. However, the site and temporal variations make it necessary to implement online monitoring and control strategies to harvest this reduction potential. In this tech note, we will show you data of successful N2O emission monitoring and control strategies.
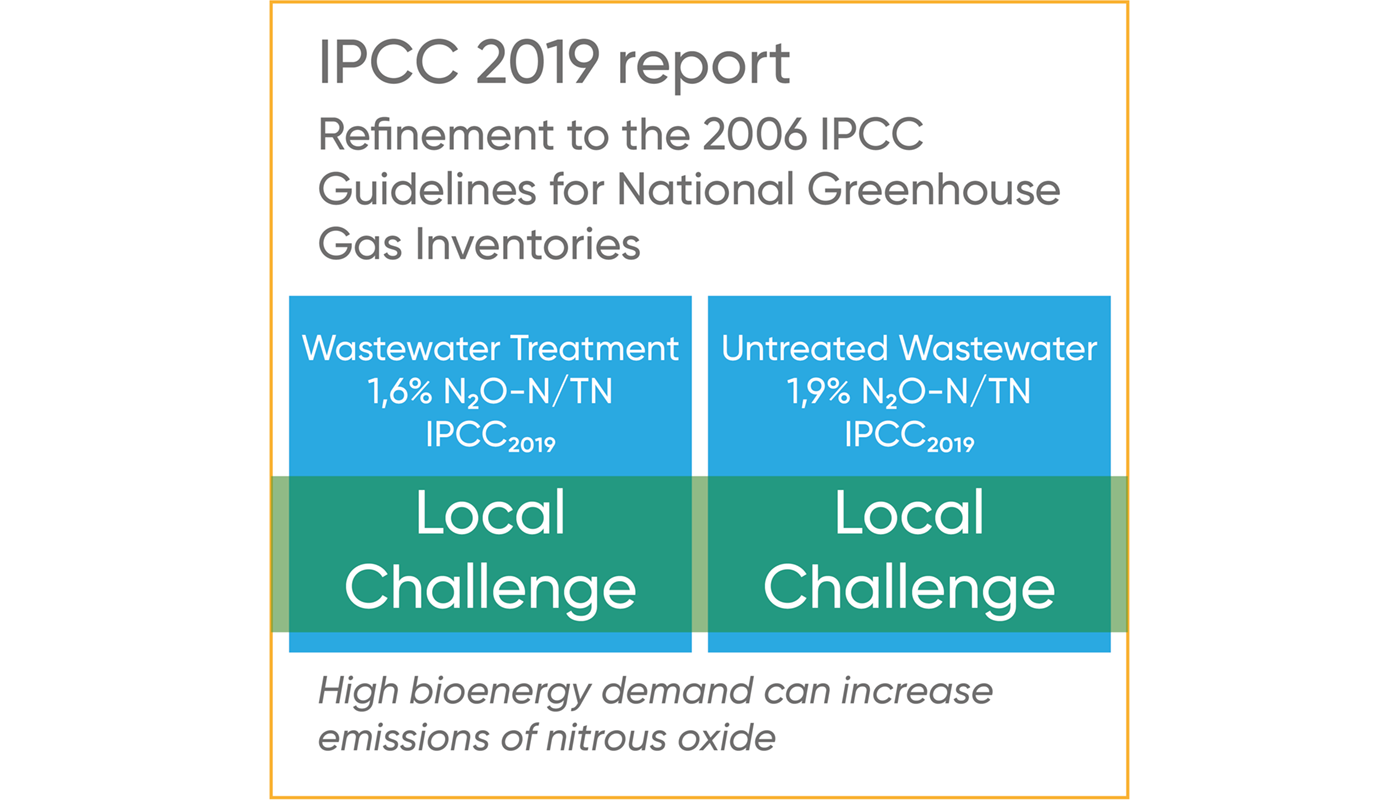
IPCC Greenhouse Gas Emission Factors
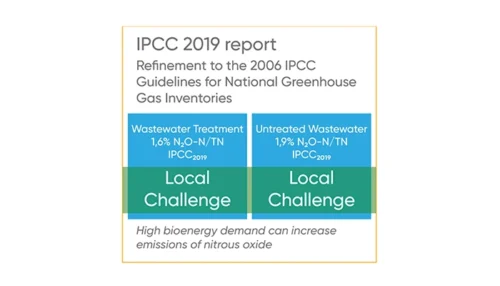
In May 2019, IPCC refined the greenhouse gas emission factors. As one of the more noticeable changes, IPCC more than tripled the N2O emission factors for WWTPs incl. the factor for direct sewage discharge to nutrient-impacted freshwater, estuarine, and marine environments.
Furthermore, IPCC stated that a shift towards higher bioenergy demand can increase emissions of nitrous oxide. Hence, the ammonia waste from biogas production needs appropriate management to avoid a negative impact on the CO2 footprint.
Real-time N2O monitoring data
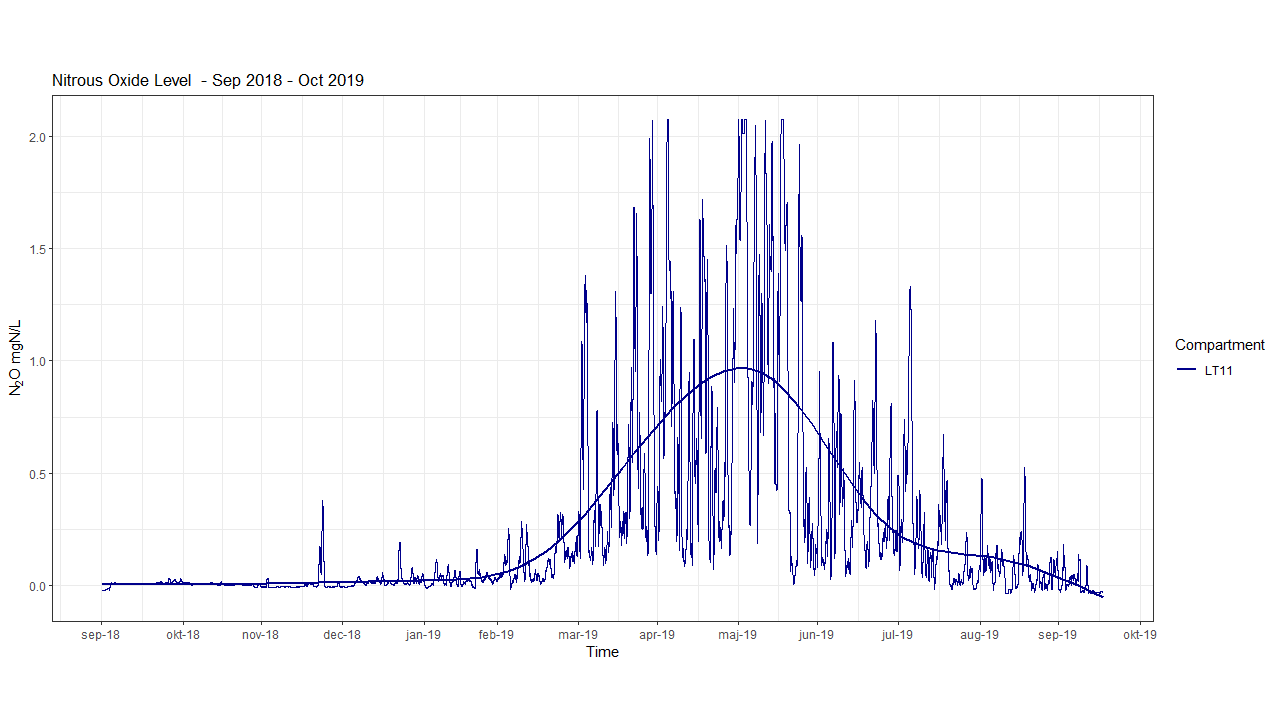
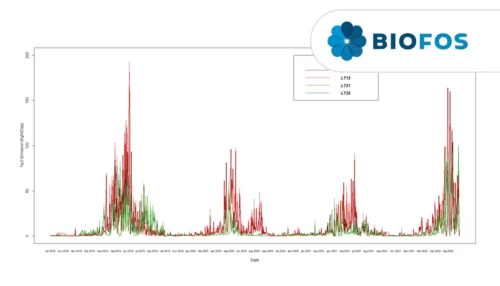
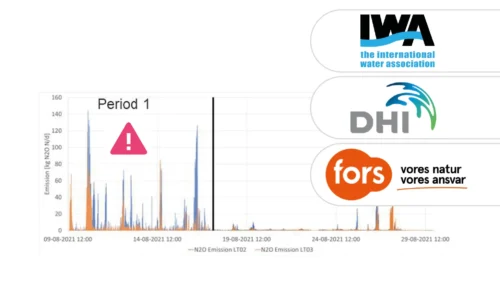
More than 1.5 years of online monitoring of the N2O concentration in a 350,000 PE WWTP shows a highly variable and also dynamic seasonal pattern. In this example, the cumulative N2O emission over +365 days was above 2.5% of the daily N-load on the plant (not shown). This N2O emission is 60% higher than the average IPCC2019 factor and indicates the importance of performing on-site monitoring of N2O rather than relying on an average assumption.
Moreover, the majority of the emission is accumulated from March to August. The large seasonal/monthly variations clearly undermine results deducted from typical short-term scientific monitoring campaigns. Especially, when the results are extrapolated to a seasonal or yearly emission result or an N2O emission factor.
Mitigation Strategy
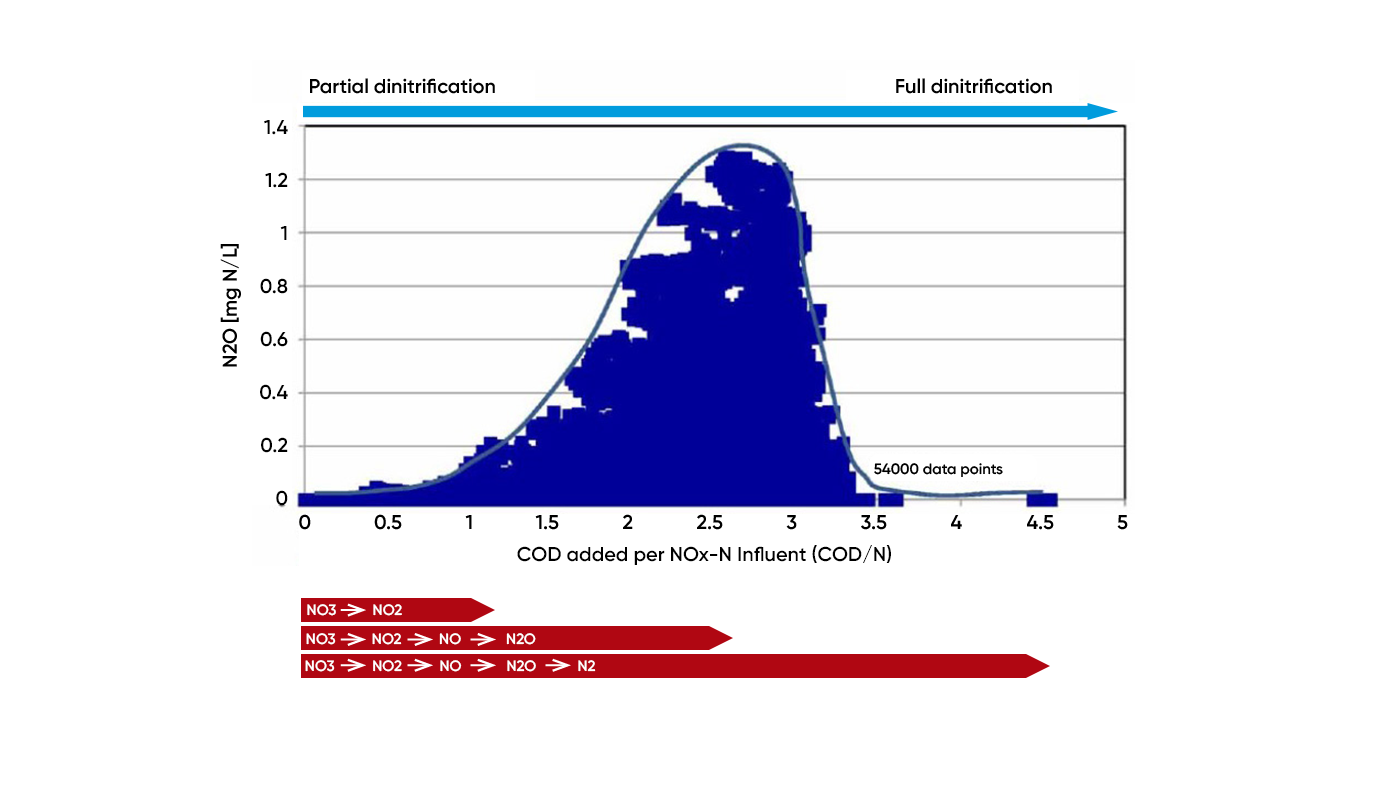
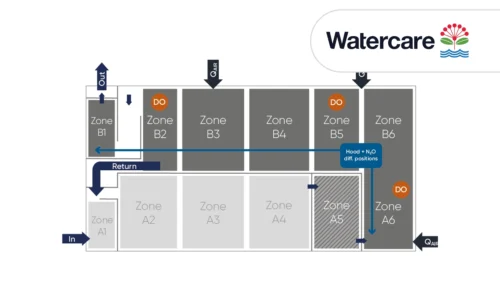
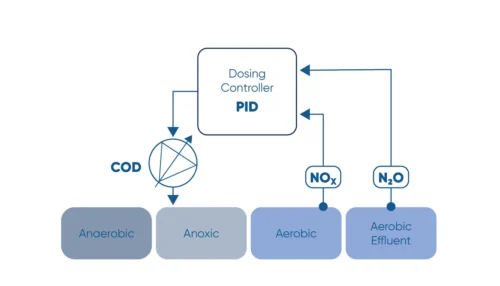
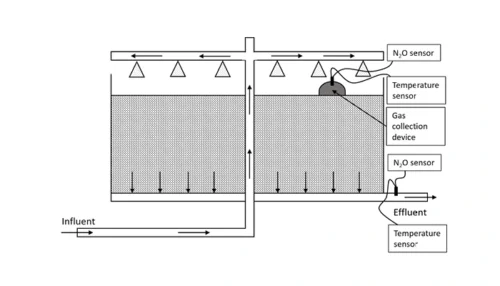
This figure shows a mitigation strategy to decrease the greenhouse gas emission and operation cost of a WWTP, which doses carbon sources to improve the effluent quality. The WWTP used two sensors in two treatment plants in parallel with NOx-N probes. The purpose was to demonstrate the applicability of the N2O wastewater sensors for automation of COD dosing pumps. The effects of operational conditions, such as COD/N ratios, and the correlation between NOx and N2O were followed.
In particular, the results showed that the N2O production was a function of influent nitrogen load and the ratio of COD/N. For optimum dosage automation of external carbon source and reducing N2O, the plant combined a feedforward control algorithm with nitrates as its measured variable and a feedback control algorithm with N2O as input variable. The WWTP used the N2O sensor as a proxy sensor for nitrates in a feedback automation of the dosing pumps, and they were able to completely avoid N2O emissions while the effluent quality was maintained below 1.2 mg N/L NOx.
VARGA Project
The Danish project VARGA has implemented and tested a number of new controls for minimizing nitrous oxide at the Avedøre WWTP. The project demonstrated a 30% reduction (4,260 ton CO2 equivalent) in the project's early stages. The full minimization potential is expected to be even greater - up to a 50-80% reduction. On a national scale, the reduction potential in Denmark will be 42-152,000 ton CO2 equivalent annually. With the adjusted upward IPCC2019 emission factor, the potential is likely to be significantly greater.
Similarly, many Unisense Environment clients have demonstrated N2O minimization potentials between 25% and 90% by balanced controlling of aeration, loading, and carbon resources with the integration of the N2O Wastewater System.
Two liquid phase N2O sensors accurately represent process dynamics and emissions in most common raceway and recirculation reactors.
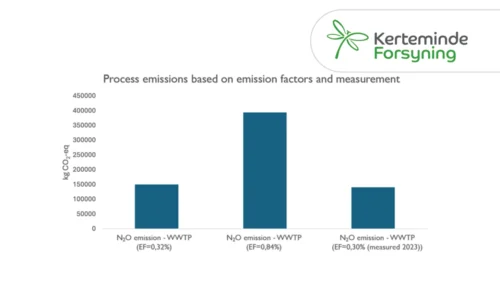
Learn how Kerteminde Forsyning applied nitrous oxide data to reduce the formation of N2O while maintaining low nitrogen emissions
Case Study: Full-scale comparison of N2O emissions determined by liquid sensors and off-gas measurement
Significant 3-fold increase in IPCC2019 wastewater N2O emission factor supported by Danish studies.
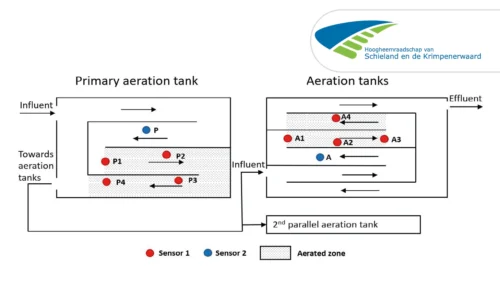
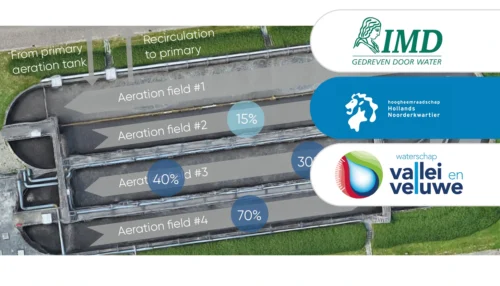
A case study from Kralingseveer WWTP in the Netherlands explores the influence of sensor placement.
Based on data from Danish WWTPs through advanced online-control.
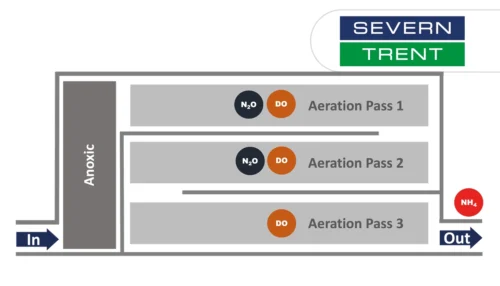
Learn about the results from N2O monitoring in the activated sludge tanks at Severn Trent’s Spernal sewage treatment plant
Monitor the N2O concentration in the liquid and use N2O as a control parameter for carbon dosage in the denitrification process.
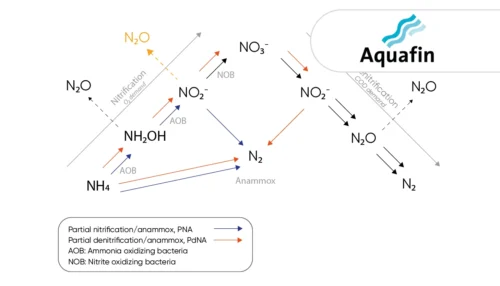
Learn how the water utility Aquafin controls emissions from deammonification processes using the the N2O Wastewater Sensor
Greenhouse gas emissions at wastewater treatment plants are coming into focus as the water industry works to reduce its climate footprint
The investment costs had initially deterred us somewhat. However ...
A study of three very different WWTPs in Denmark: Bjergmarken (125,000 PE), Holbæk (60,000 PE), and Hvalsø (11,570 PE)
The available data show that the nitrous oxide emission varies in time and between wastewater treatment plants.
Information regarding N2O emissions from trickling filters is limited, partly caused by the difficulties in capturing off-gases.
Significant 3-fold increase in IPCC2019 wastewater N2O emission factor supported by Danish studies.