
Determining the Actual N2O Derived CO2 Footprint
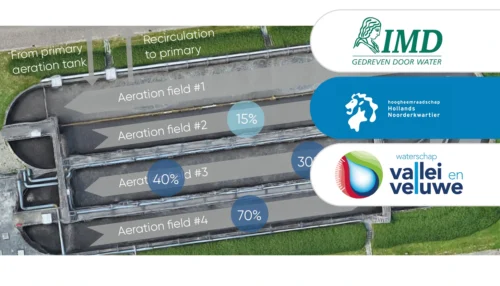
The utility runs both recirculation and biofilm wastewater processes. Due to increasing uncertainty in using emission key numbers, the utility contacted Unisense Environment for assistance in determining the actual N2O derived CO2 footprint. As the foundation for the new initiative, the utility started out with monitoring N2O emission from a standard recirculation.
First Data Analysis after Two Weeks
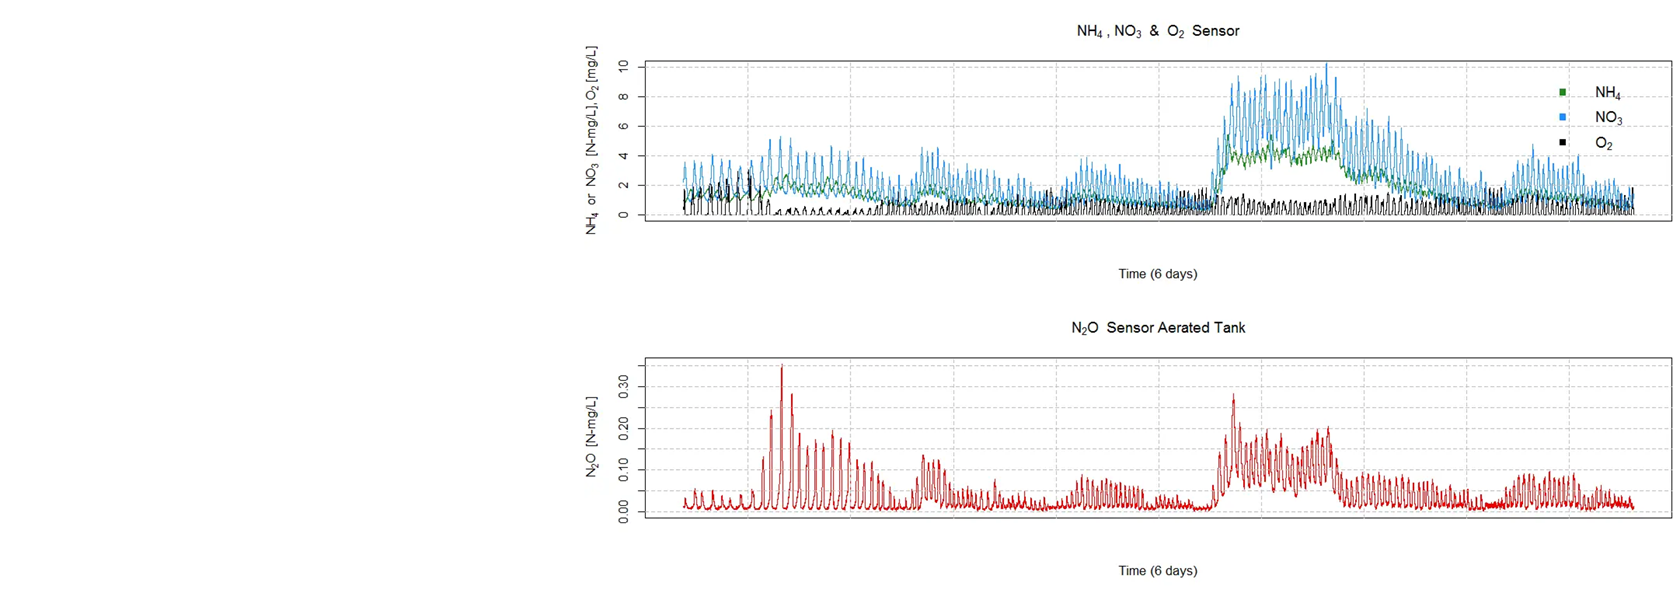
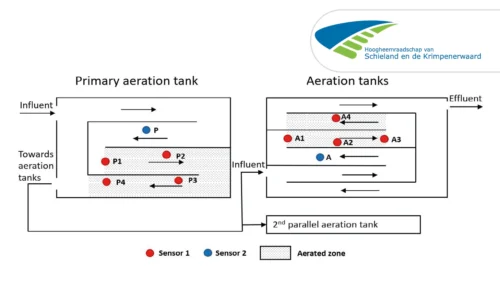
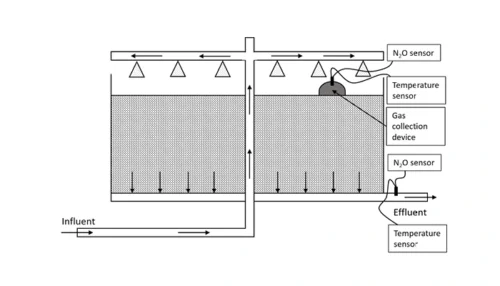
In order to save energy and increase the N-removal capacity, the utility operated the aerobic zone with intermittent aeration, allowing denitrification in the aerated zone depending on the ammonium levels in the tank. Unisense Environment installed two N2O Wastewater Systems, one placed in the anoxic tank and the other in the aerobic tank. To facilitate the understanding of the N2O formation, the utility logged N2O sensor data with all other plant data through a standard integration to the SCADA system.
Following a quick 2-point calibration procedure, the sensors started monitoring N2O levels. After a 14 day measuring period, the utility extracted a full data series from the SCADA system and sent the data to Unisense Environment for analysis. Using different data management tools, Unisense Environment documented the overall correlations and in particular the N2O production.

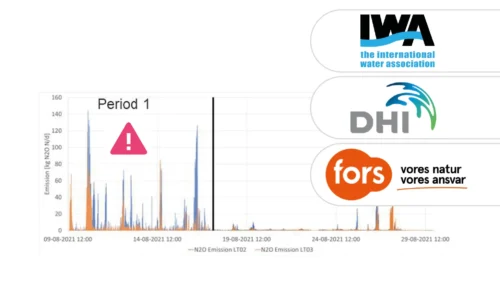
Large Variations during a 14-day Measurement Campaign
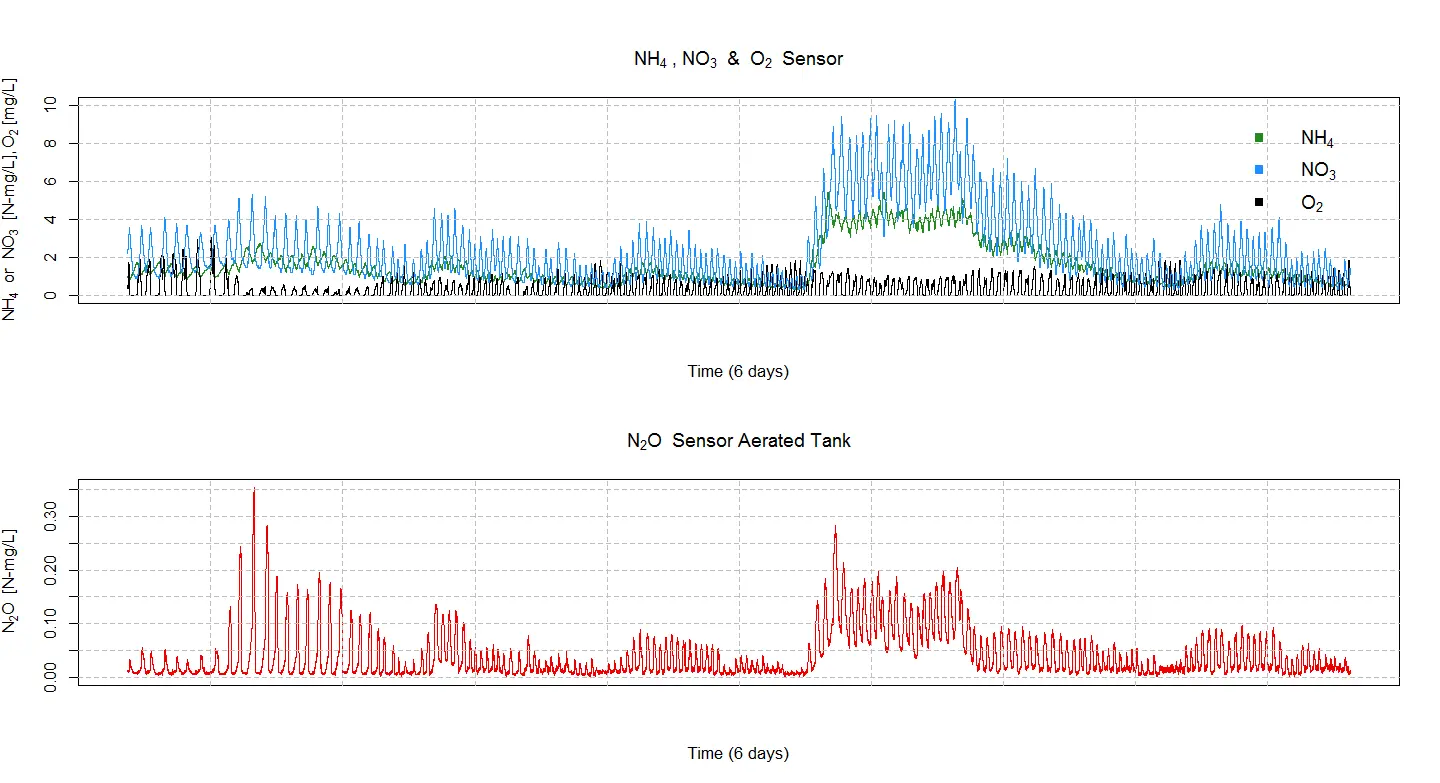
From the 14-day period, it was clear that the variation in N2O emission was extensive. The main emission over the period was linked to two high load events that led to 53% of the total N2O emission during 42 hours out of the 14 days. Furthermore, low dissolved oxygen set points in the beginning of the campaign led to a significant increase in the N2O concentration, clearly stressing the correlation between low oxygen and N2O formation. During the analyzed period, the N2O formation in the anoxic tank was very low and only during a high ammonium period did the N2O concentration increase to 0.3 N-mg/L for 30 hours. In the aerated part, N2O was mainly produced during the anoxic phases introduced by the intermittent aeration and subsequently stripped to the atmosphere by the aeration.
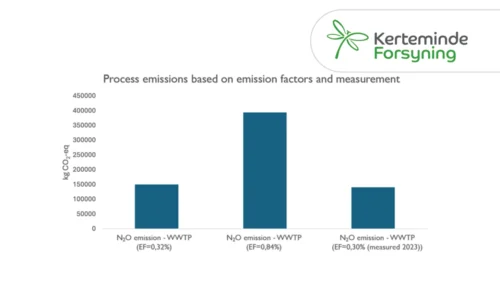
Finally, emission calculations were performed using peer reviewed and validated models to assess the N2O emissions and derived CO2 equivalents. This was compared with the aeration power derived CO2 equivalents and presented to the management of the water utility as part of a 2-day consultancy service. The total carbon footprint from the period was calculated to be 10 ton CO2 equivalents with N2O derived CO2 accounting for 59% of the total emission.
A Shortlist of Problems and Possible Solutions
From the short monitoring and data analysis campaign, a shortlist of problems and possible solutions was derived:
- The N2O concentration and emission is highly variable
- Dissolved oxygen control is important to avoid elevated N2O production and emission
- Short periods of high ammonium loads should be avoided by balancing the influent load
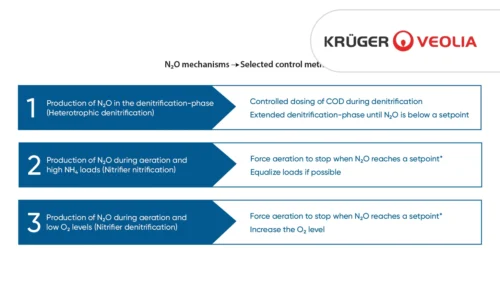
- Control strategies with COD enhanced denitrification can potentially diminish the N2O emission
- Energy optimization using pause-aeration strategies must be coupled with N2O monitoring to avoid excessive N2O emissions.
With a small investment, the utility gained a real insight into the source and causes of its N2O derived emissions and can now act towards minimizing the climate impact from N2O.

Two liquid phase N2O sensors accurately represent process dynamics and emissions in most common raceway and recirculation reactors.
Learn how Kerteminde Forsyning applied nitrous oxide data to reduce the formation of N2O while maintaining low nitrogen emissions
Case Study: Full-scale comparison of N2O emissions determined by liquid sensors and off-gas measurement
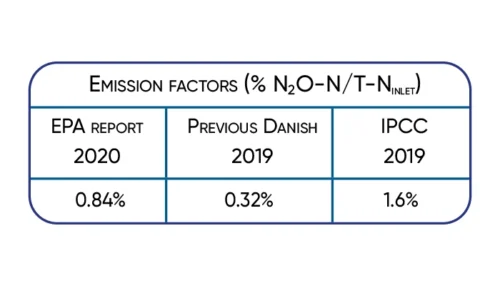
Significant 3-fold increase in IPCC2019 wastewater N2O emission factor supported by Danish studies.
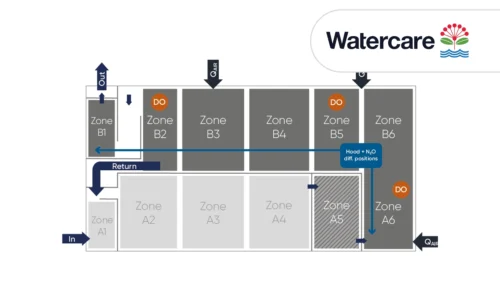
A case study from Kralingseveer WWTP in the Netherlands explores the influence of sensor placement.
Based on data from Danish WWTPs through advanced online-control.
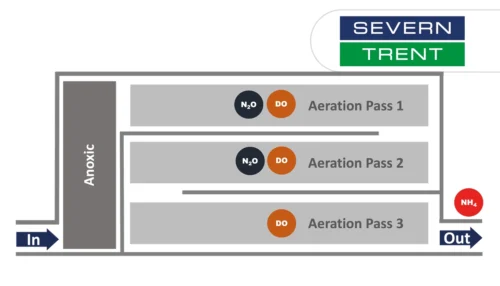
Learn about the results from N2O monitoring in the activated sludge tanks at Severn Trent’s Spernal sewage treatment plant
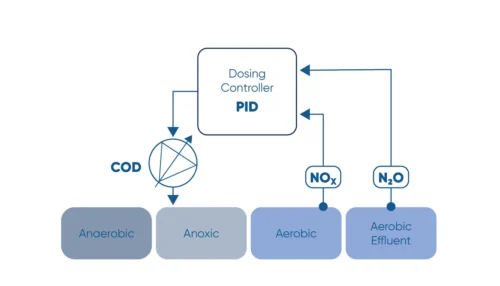
Monitor the N2O concentration in the liquid and use N2O as a control parameter for carbon dosage in the denitrification process.
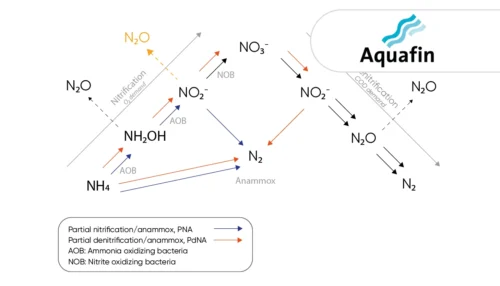
Learn how the water utility Aquafin controls emissions from deammonification processes using the the N2O Wastewater Sensor

Greenhouse gas emissions at wastewater treatment plants are coming into focus as the water industry works to reduce its climate footprint

The investment costs had initially deterred us somewhat. However ...
A study of three very different WWTPs in Denmark: Bjergmarken (125,000 PE), Holbæk (60,000 PE), and Hvalsø (11,570 PE)
The available data show that the nitrous oxide emission varies in time and between wastewater treatment plants.
Information regarding N2O emissions from trickling filters is limited, partly caused by the difficulties in capturing off-gases.
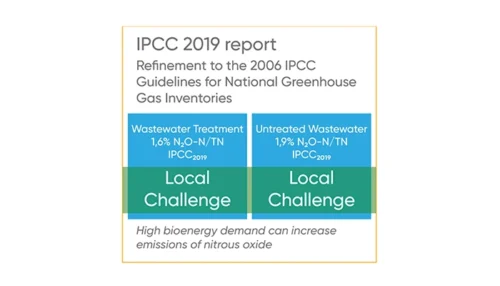
Significant 3-fold increase in IPCC2019 wastewater N2O emission factor supported by Danish studies.