
Case Study: Full-scale comparison of N2O emissions determined by liquid sensors and off-gas measurement
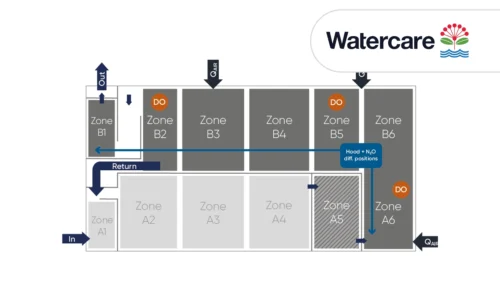
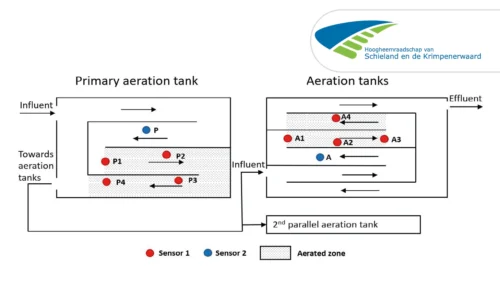
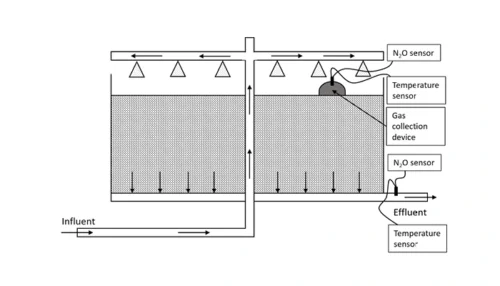
After solids are removed through settlement, Rosedale WWTP achieves biological nitrogen removal through nitrification and denitrification in a Modified Ludzack-Ettinger (MLE) process divided into 4 trains. A simplified representation of the 4th process train is presented in Figure 1 (click image to enlarge and read description).
The tank has an airflow measurement for each of the three aeration zones A5/A6, B5/B6 and B2/B3/B4. This allows monitoring of the airflow split between the different aerobic zones. The airflow rate per cell was calculated based on the measured air flow rate to an aeration zone and assuming the air is distributed in proportion to the number of diffusers in each cell.
Monitoring N2O with Off-Gas and Liquid Phase Sensors
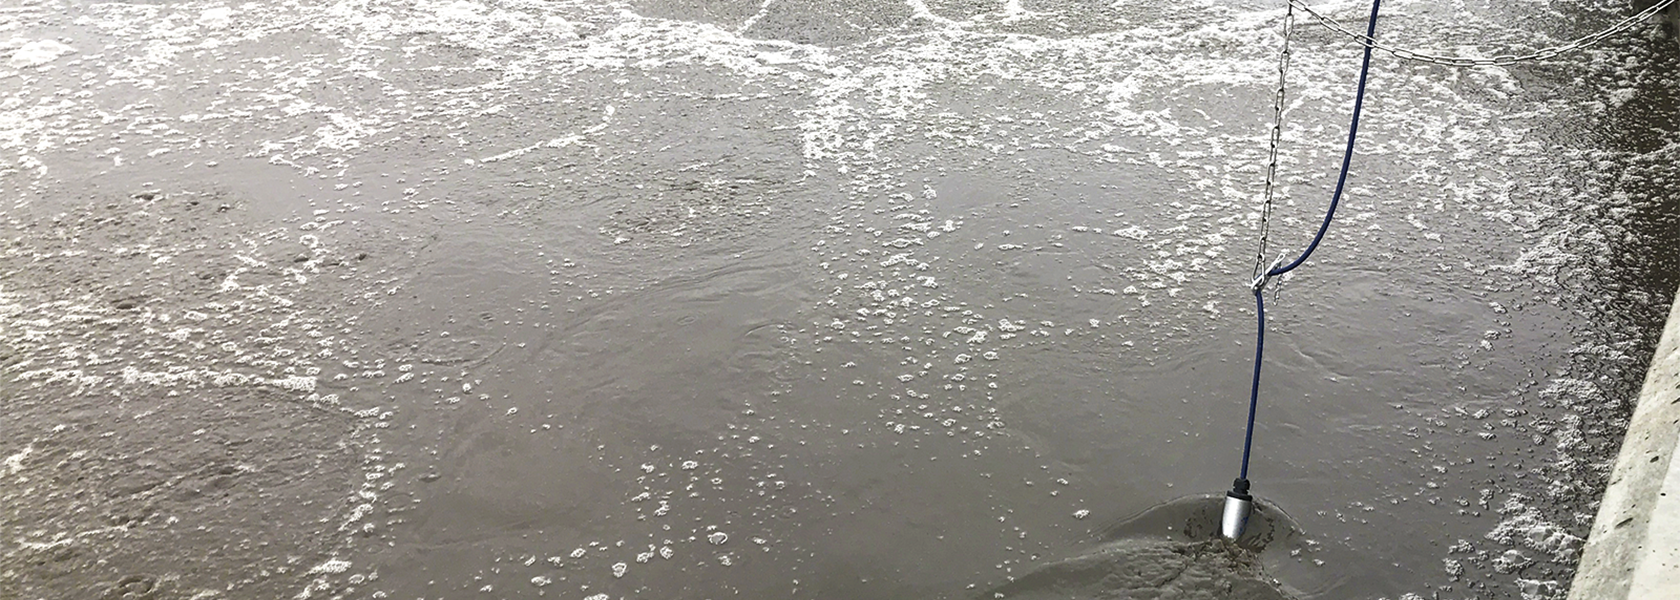
N2O monitoring was implemented in the aerated parts of the sludge tanks. Measuring equipment consisted of gas hoods connected to a Picarro gas analyzer and two N2O Wastewater Sensors for the liquid phase.
One N2O Wastewater Sensor and gas hood were moved progressively through the different aerobic cells, from cell A6 to cell B1. This was used to measure the gas-phase and liquid phase N2O concentrations, to allow an understanding of both the N2O generation (liquid phase) and emission (stripping into the gas phase).
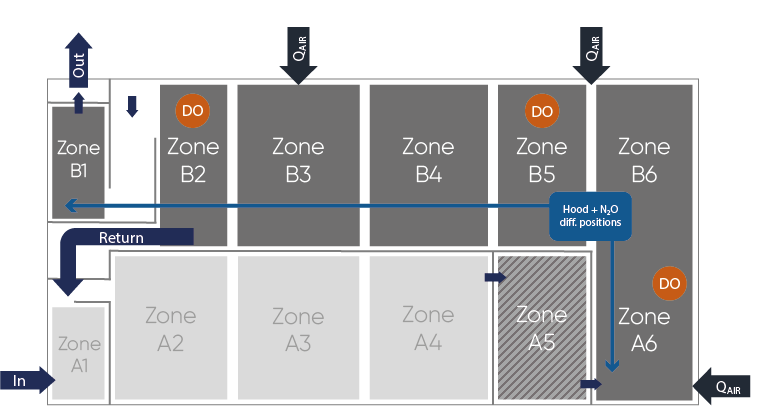
Figure 1: Schematic drawing of the MLE4 activated sludge process with direction of water flow and measuring locations. Light grey zones A1-A4 are unaerated while dark grey zones A6 and B1-B6 are aerated. Zone A5 can be aerated on demand. Hood: Location for off-gas sampling – measured in all aerated zones; N2O: location of N2O Sensor; DO: Location of oxygen sensor; QAIR: location of airflow measurement.
Comparing N2O Concentrations from Off-Gas and Sensors
The complete set of equations including temperature correction in the Unisense Environment manual1 were used for calculating the off-gas N2O concentration in aerated zones based on the dissolved N2O concentration and the superficial gas velocity (air flow rate divided by reactor aerated surface area).
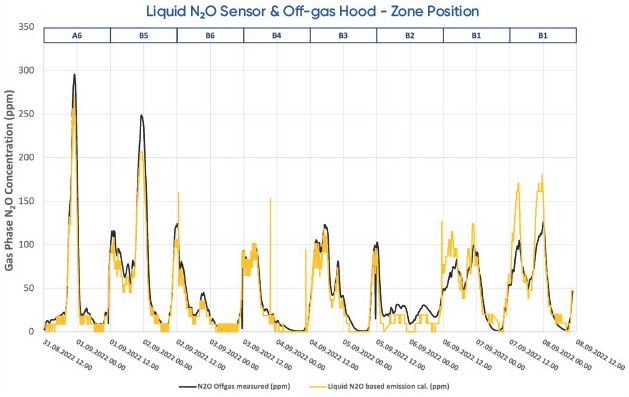
The N2O concentration in the off-gas was measured and then compared with the emission predicted by the liquid N2O sensor and airflow. Figure 2 shows the comparison between the measured and predicted concentrations.
The results showed very good agreement between the gas phase N2O concentration calculated based on the liquid N2O sensor and those measured in the gas phase. At Rosedale WWTP, 91% of the measured off-gas emission reference was described using the liquid N2O sensor and calculations, exemplifying that the dissolved N2O concentration can be used to provide a good estimate of N2O emission rates2.
The average N2O emission rate
The average N2O emission rate for a two-week monitoring period was calculated by summing up the N2O emissions from the individual cells. The emission from each cell was found by multiplying the off-gas N2O concentration from the cell by the measured airflow to that cell. For practical reasons it is not possible to measure the off-gas concentration in every cell simultaneously. For this study the N2O emissions from the anoxic zones are assumed to be small and have been ignored (see ref. 1 for more information).
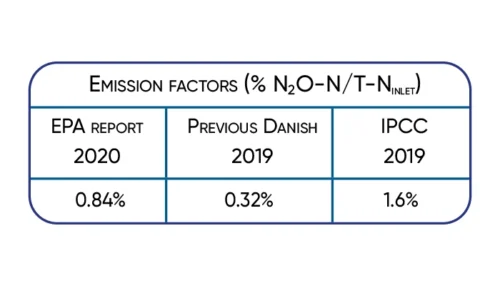
The average N2O emission rate for MLE4 for the two-week period was calculated to 4.15 kg N2O-N/d. Based on the average influent total nitrogen load to the plant during this period with 25% going to MLE4, an emission factor (EFN2O) of 0.005 kg N2O-N/kgNinfluent (0.5% N2O-N/TNinfluent ) can be deducted.
Long-Term Monitoring Recommended
The survey was conducted over a short period and the recommendation is that longer-term monitoring will provide further confidence in the EFN2O figure. Monitoring for a period of at least a year would be required to understand the seasonal variations.
Two liquid phase N2O sensors accurately represent process dynamics and emissions in most common raceway and recirculation reactors.
Learn how Kerteminde Forsyning applied nitrous oxide data to reduce the formation of N2O while maintaining low nitrogen emissions
Case Study: Full-scale comparison of N2O emissions determined by liquid sensors and off-gas measurement
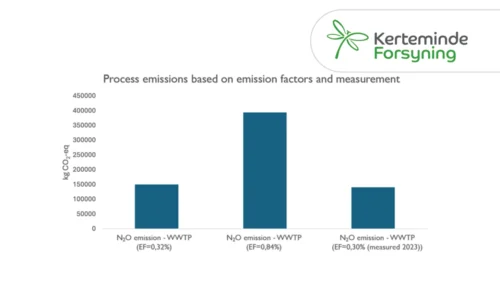
Significant 3-fold increase in IPCC2019 wastewater N2O emission factor supported by Danish studies.
A case study from Kralingseveer WWTP in the Netherlands explores the influence of sensor placement.
Based on data from Danish WWTPs through advanced online-control.
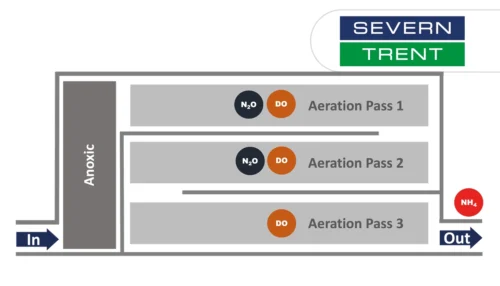
Learn about the results from N2O monitoring in the activated sludge tanks at Severn Trent’s Spernal sewage treatment plant
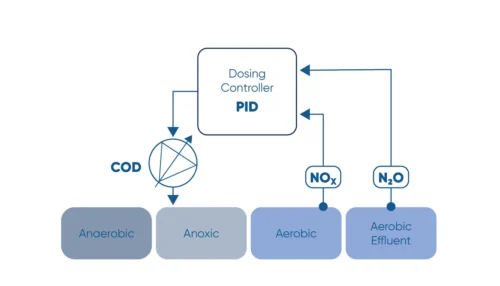
Monitor the N2O concentration in the liquid and use N2O as a control parameter for carbon dosage in the denitrification process.
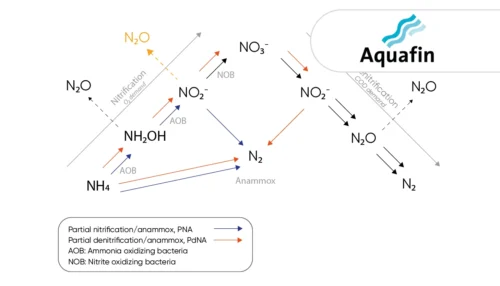
Learn how the water utility Aquafin controls emissions from deammonification processes using the the N2O Wastewater Sensor
Greenhouse gas emissions at wastewater treatment plants are coming into focus as the water industry works to reduce its climate footprint
The investment costs had initially deterred us somewhat. However ...
A study of three very different WWTPs in Denmark: Bjergmarken (125,000 PE), Holbæk (60,000 PE), and Hvalsø (11,570 PE)
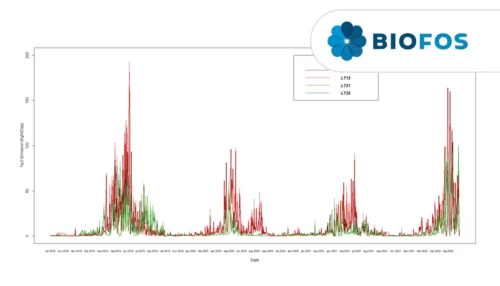
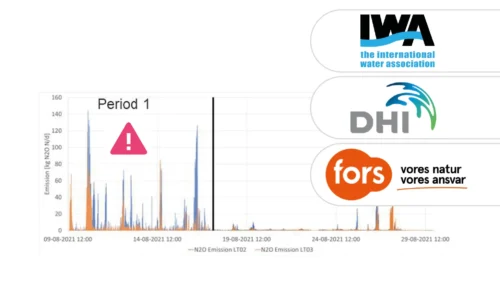
The available data show that the nitrous oxide emission varies in time and between wastewater treatment plants.
Information regarding N2O emissions from trickling filters is limited, partly caused by the difficulties in capturing off-gases.
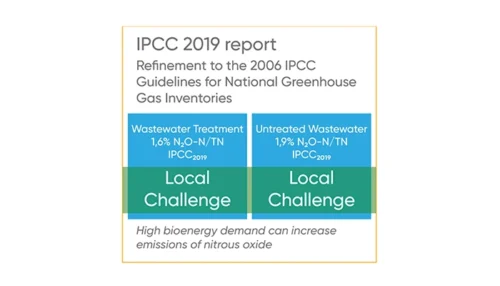
Significant 3-fold increase in IPCC2019 wastewater N2O emission factor supported by Danish studies.