
Research has shown that highly loaded processes based on Anammox are a risk for large emissions of N2O.
Sludge reject water from the dewatering processes returns high nitrogen (N) loads to the WWTP which increases the need for aeration. To reduce aeration energy, WWTPs often install intensified side stream processes, such as deammonification using anammox bacteria.
Anammox as Alternative Process
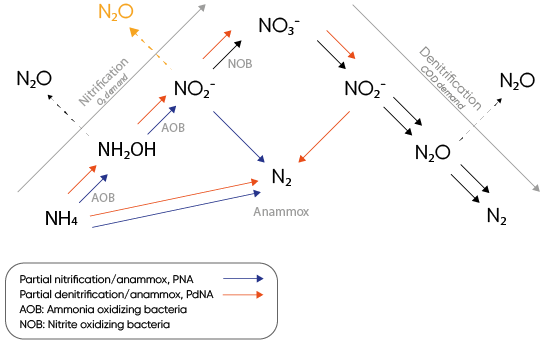
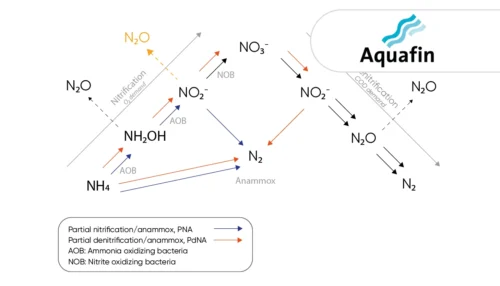
Anammox is a nitrogen removal process where N2 is formed from NH4+ and NO2- (Fig. 1). Controlling the substrate availability and balance is important for the successful implementation and operation of the process.
Two substrate control strategies that have been suggested are PNA (Partial nitrification/anammox) and PdNA (Partial denitrification/anammox). The PNA process aims at partial nitrification by inhibiting NOB (nitrite-oxidizing bacteria) to supply NO2- for anammox. On the other hand, PdNA aims at partial denitrification to supply NO2- (Fig. 1).
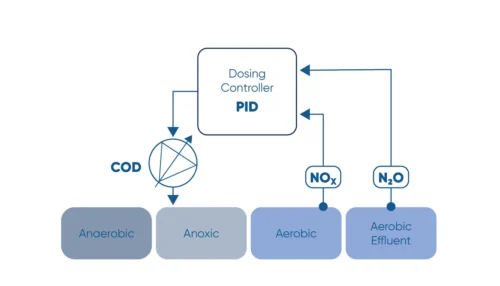
While it might appear as a detour, PdNA for anammox is often operationally easier to achieve. In PdNA, the relationship between COD/N and N2O can be used for controlling the partial denitrification process to accumulate nitrite for anammox by keeping the COD/N ratio below 1.
The N2O sensor can monitor the N2O formation and decrease the carbon loading to achieve partial denitrification to NO2-, which can be used for anammox. The carbon can then be harvested and used for biogas production.
NO2- is the key substrate, besides NH4+, for anammox, but it is difficult to measure NO2- with present sensors. The measurement will be indirect as NO2- is formed and consumed inside biofilm or granules and autosampler-based technologies do not deliver real-time data. Unlike NO2-, N2O is not consumed by the anammox bacteria and therefore online N2O monitoring will provide a more precise measure of the substrate balance in real time. As N2O is tightly linked to NO2- concentration through both nitrification and denitrification, the N2O sensor can be used as a proxy for NO2-.
N2O Mitigation from Pilot to Full-Scale
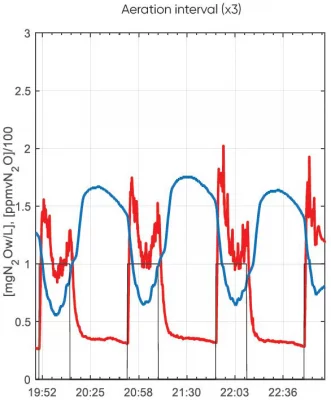
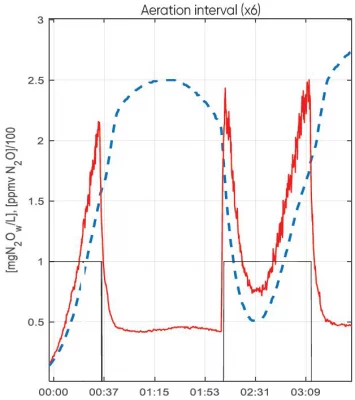
The main Belgian utility for sewer transport and wastewater treatment, Aquafin, has set ambitious targets for climate neutrality. To better understand their key emission sources, Aquafin monitors N2O in a pilot-scale deammonification plant, a twin of the full-scale process at the WWTP in Dendermonde, Belgium. The reactor is equipped with off-gas nitrous oxide measurement as well as a Unisense Environment N2O wastewater sensor for dissolved N2O. With the combination of the two measurements, Aquafin can fine-tune the effect of different aeration regimes.
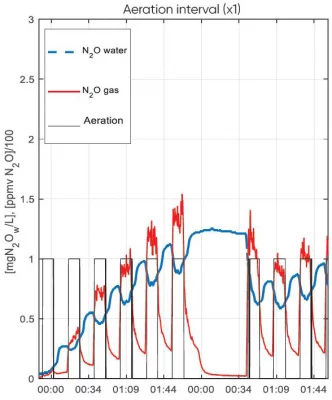
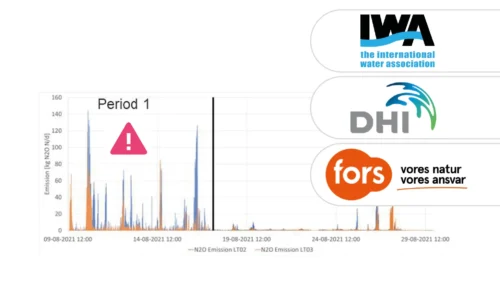
The figures show the results of short-pulsed aeration (left) vs. longer aeration periods (right). In order to reduce emissions, it was advantageous to aerate in shorter pulses, avoiding the build-up of nitrite, minimizing dissolved N2O formation, and promoting subsequent biomass selection. Short pulses of aeration resulted in a drop in the emission factor from 3.3% to 1.3% kg N2O/kg Nremoved. With these results in hand, Aquafin was able to implement short aeration periods at the WWTP in Dendermonde to start minimizing N2O in full-scale. A simulated full control implementation produced a further drop in the N2O emission factor to 0.9% kg N2O/kg Nremoved, while the load capacity dropped as well.
According to Alessio Fenu, senior R&D Engineer at Aquafin, “the dissolved measurement of N2O is a very useful tool for investigating any process in view of N2O mitigation, and crucial in setting up a real-time process control.”
In another example, researchers from a leading utility in Denmark have developed a control strategy where aeration and loading are based on the online N2O value instead of controlling it based on pH. In essence, an N2O setpoint is used to reduce aeration, tuning down nitrification when there is too much NO2- present. This effectively uses N2O as a proxy for NO2- and reduces the likelihood of a substrate imbalance of NH4+/ NO2- and subsequent N2O formation.
Avoid N2O emission and document your CO2 footprint
In conclusion, the N2O Wastewater Sensor can be used as a tool for process control in anammox by tightly controlling the substrate ratio between Nitrite and Ammonium. Specific control strategies depend on the reactor design and its limitations. Future-oriented utilities and technology providers have the ability to document CO2-footprints from sidestream processes, allowing direct comparison with conventional activated sludge processes. This allows making informed decisions about process control and future investments with overall climate neutrality as a target.
Two liquid phase N2O sensors accurately represent process dynamics and emissions in most common raceway and recirculation reactors.
Learn how Kerteminde Forsyning applied nitrous oxide data to reduce the formation of N2O while maintaining low nitrogen emissions
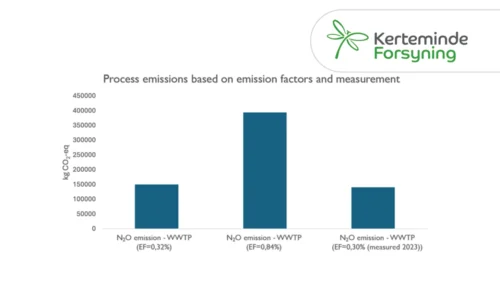
Case Study: Full-scale comparison of N2O emissions determined by liquid sensors and off-gas measurement
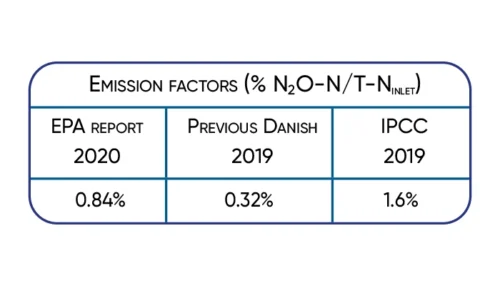
Significant 3-fold increase in IPCC2019 wastewater N2O emission factor supported by Danish studies.
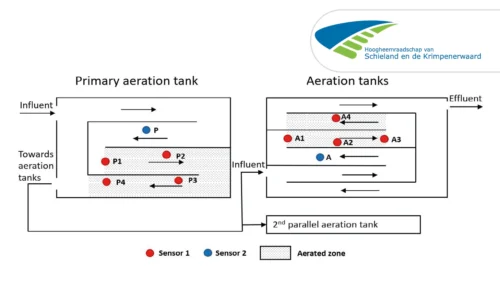
A case study from Kralingseveer WWTP in the Netherlands explores the influence of sensor placement.
Based on data from Danish WWTPs through advanced online-control.
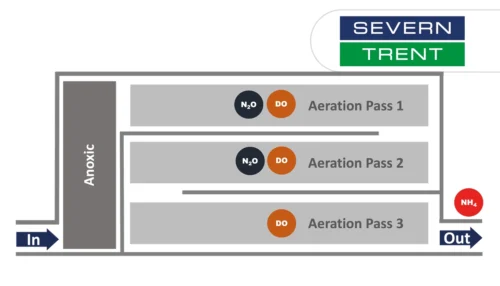
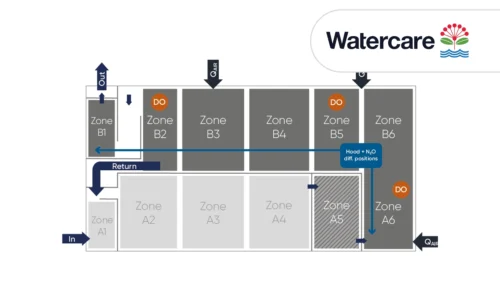
Learn about the results from N2O monitoring in the activated sludge tanks at Severn Trent’s Spernal sewage treatment plant
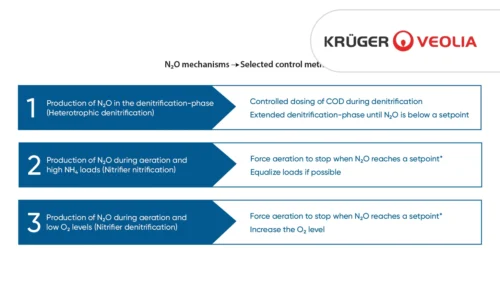
Monitor the N2O concentration in the liquid and use N2O as a control parameter for carbon dosage in the denitrification process.
Learn how the water utility Aquafin controls emissions from deammonification processes using the the N2O Wastewater Sensor
Greenhouse gas emissions at wastewater treatment plants are coming into focus as the water industry works to reduce its climate footprint
The investment costs had initially deterred us somewhat. However ...
A study of three very different WWTPs in Denmark: Bjergmarken (125,000 PE), Holbæk (60,000 PE), and Hvalsø (11,570 PE)
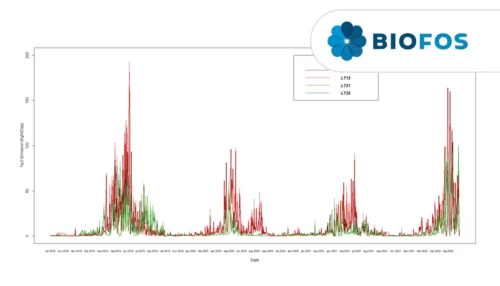
The available data show that the nitrous oxide emission varies in time and between wastewater treatment plants.
Information regarding N2O emissions from trickling filters is limited, partly caused by the difficulties in capturing off-gases.
Significant 3-fold increase in IPCC2019 wastewater N2O emission factor supported by Danish studies.