
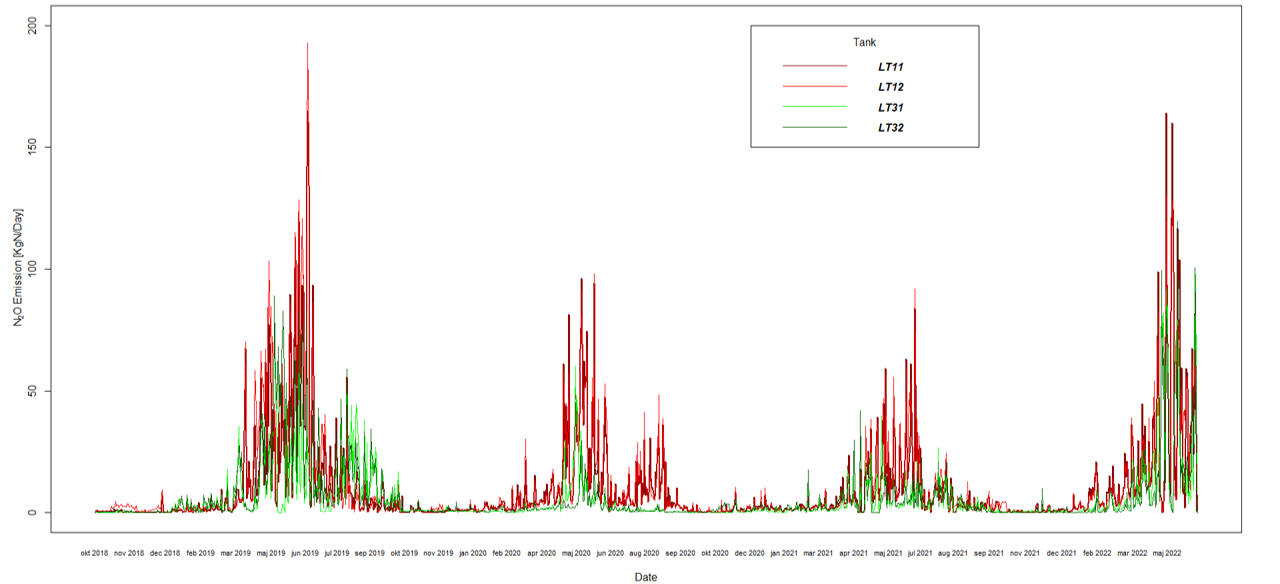
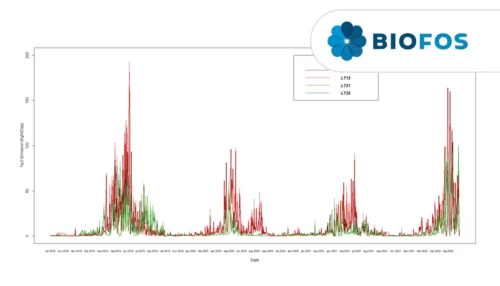
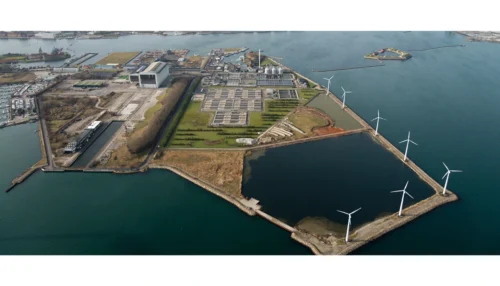
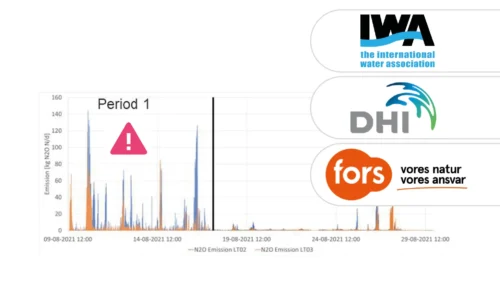
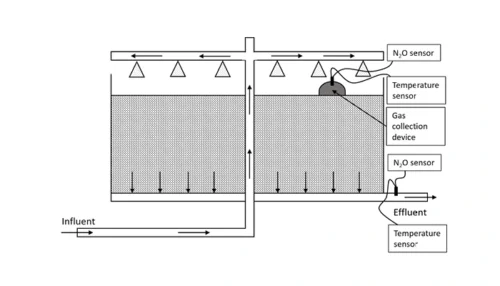
Over more than 4 years, nitrous oxide emissions from BIOFOS Avedøre’s biological process tanks have been measured to derive the underlying process mechanisms responsible for climate gas emissions. Figure 1 shows the four years of online monitoring of N2O in 4 of the 8 process compartments at Avedøre WRRF (i.e. monitoring 50% of the bioprocess). The data was collected in the SCADA system and the N2O emission is presented as daily averages of KgN N2O /day. The graph highlights the dynamic seasonal and yearly patterns. Although the yearly pattern is repeating, the emission magnitude varies significantly between years.
Insights from Continuous Monitoring of Nitrous Oxide
During the 4 years of online N2O emission monitoring, the data showed a high and variable EFN2O above the IPCC2019 factor based on daily TNLoad or daily TNTreated. Furthermore, simple process changes have made a significant impact on the cumulative N2O emissions. Based on the IPCC CO2-equivalent factor (CO2-eqv) of 298 kg CO2 per kg N2O, the total CO2 footprint ranged from 18,396 in 2019 and 9,885 Ton CO2-eqv in 2021. On average, in the periods of winter and summer emissions are 6.22 and 49.79 Ton CO2-eqv/day.
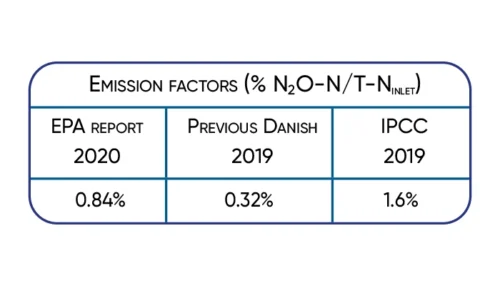
The EFN2O of Avedøre WRRF is 2-4 times higher than national Danish emission factor and the IPCC2019 factors. This highlights the importance of performing on-site monitoring of N2O rather than relying on average assumptions. N2O emission and inferred CO2 footprint were highly variable and yet seasonally dependent, emphasizing the need for long-term continuous monitoring.
MLSS Control: A Key Factor in Lowering N2O Emissions
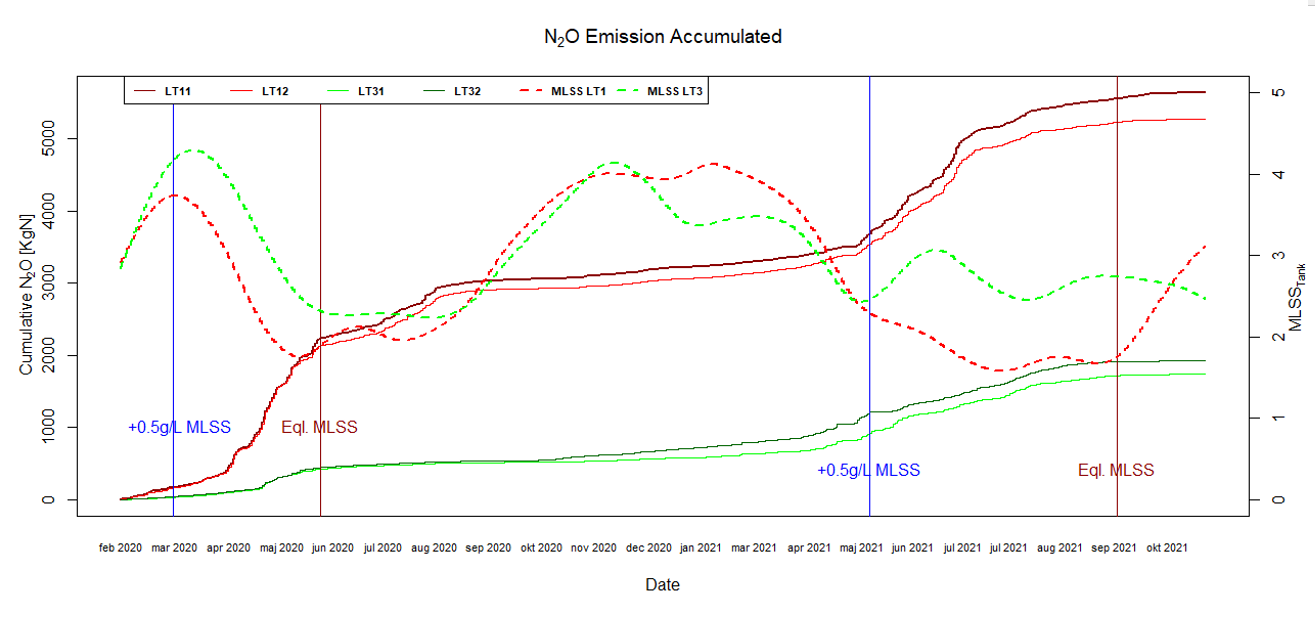
Law et al. (2012) found that increased N2O production is due to an increased specific NH3 oxidation rate by AOBs. To decrease this rate, we tested increasing the MLSS (mixed liquor suspended solids) concentration in LT31 and LT32 while keeping LT11 and LT12 as reference tanks. Figure 2 shows a significant reduction in N2O emissions during the spring months of 2020 and 2021, matching with the increased MLSS concentration.
The MLSS controlled tanks exhibited a lower EFN2O of 0.58% and 0.83% of the daily TNLoad for the years 2020 and 2021. The large seasonal and yearly variations demonstrate the need for longterm monitoring campaigns and the present work exemplifies the difficulty in extrapolating even yearly emission results or use of a reference year for a general N2O emission factor.
Abstract presented at the IWA World Water Congress 2022.
References
Baresel, C., Andersson, S., Yang, J., Andersen, M.H. 2016 Comparison of nitrous oxide (N2O) emissions calculations at a Swedish wastewater treatment plant based on water concentrations versus off-gas concentrations. Advances in Climate Change Research, 7(3), p 185-191.
2019 Refinement Report https://www.ipcc-nggip.iges.or.jp/public/2019rf/pdf/19R_V5_advance.zip
Andersen, M.H., Chen, X., Mielczarek, A., Madsen, J.A, G. Sin, G., and Thornberg, D. 2021 Effect of nitrogen loading and control strategies on online N2O emission and CO2 accounting at fullscale. IWA Digital World Water Congress 2021
Law, Y., Ni, B-J., Lant, P., Yuan, Z. 2012 N2O production rate of an enriched ammonia-oxidising bacteria culture exponentially correlates to its ammonia oxidation rate.

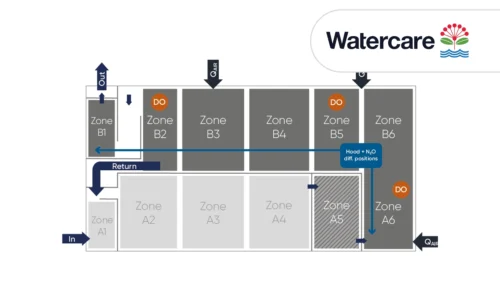
Two liquid phase N2O sensors accurately represent process dynamics and emissions in most common raceway and recirculation reactors.
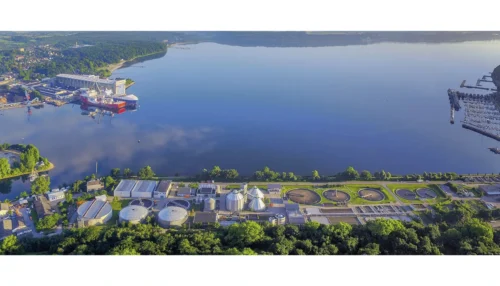
Learn how Kerteminde Forsyning applied nitrous oxide data to reduce the formation of N2O while maintaining low nitrogen emissions
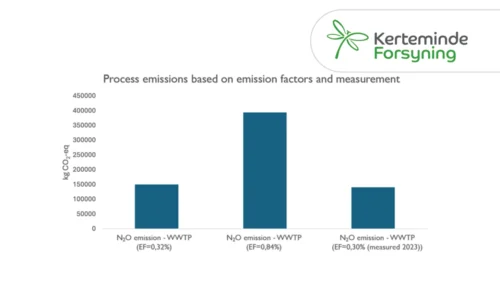
Case Study: Full-scale comparison of N2O emissions determined by liquid sensors and off-gas measurement
Significant 3-fold increase in IPCC2019 wastewater N2O emission factor supported by Danish studies.
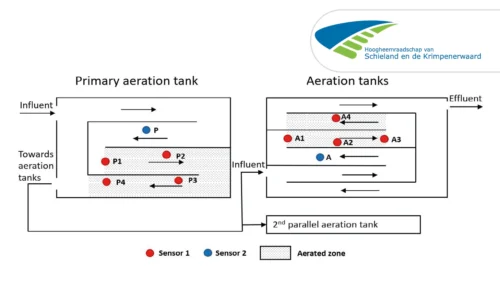
A case study from Kralingseveer WWTP in the Netherlands explores the influence of sensor placement.
Based on data from Danish WWTPs through advanced online-control.
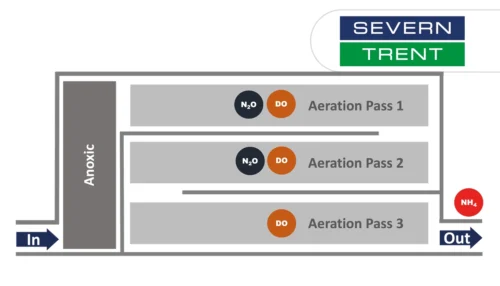
Learn about the results from N2O monitoring in the activated sludge tanks at Severn Trent’s Spernal sewage treatment plant
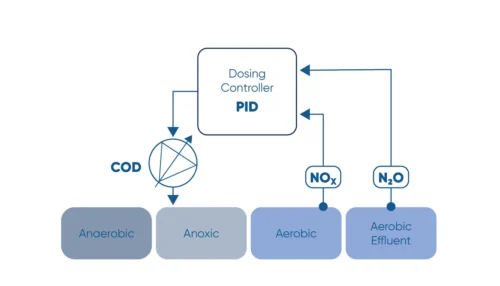
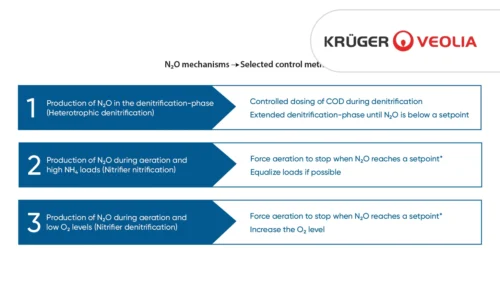
Monitor the N2O concentration in the liquid and use N2O as a control parameter for carbon dosage in the denitrification process.
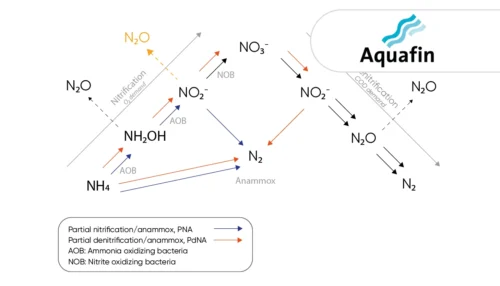
Learn how the water utility Aquafin controls emissions from deammonification processes using the the N2O Wastewater Sensor
Greenhouse gas emissions at wastewater treatment plants are coming into focus as the water industry works to reduce its climate footprint
The investment costs had initially deterred us somewhat. However ...
A study of three very different WWTPs in Denmark: Bjergmarken (125,000 PE), Holbæk (60,000 PE), and Hvalsø (11,570 PE)
The available data show that the nitrous oxide emission varies in time and between wastewater treatment plants.
Information regarding N2O emissions from trickling filters is limited, partly caused by the difficulties in capturing off-gases.
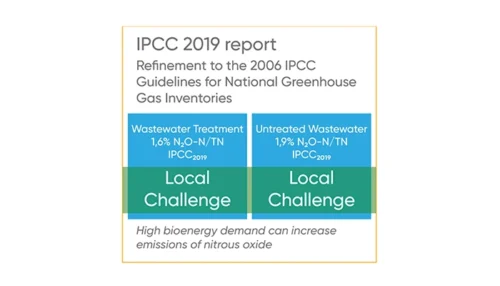
Significant 3-fold increase in IPCC2019 wastewater N2O emission factor supported by Danish studies.