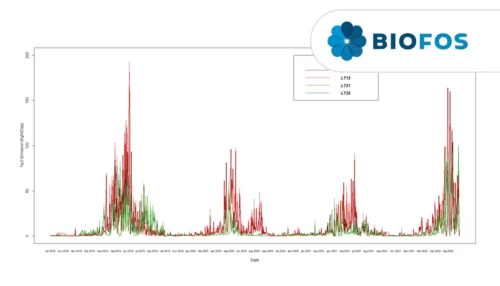
N2O emission varies in time and between plants
Nitrous oxide (N2O) is a greenhouse gas produced during wastewater treatment primarily through biological processes. As N2O is a greenhouse gas 273 times stronger than CO2, the N2O emissions are substantial in the total climate impact of wastewater treatment.
Based on limited data, the WWTPs have used a factor to estimate the N2O emission. However, the available data show that the N2O emission varies in time and between plants. Therefore, more data is needed to achieve a reliable estimate of the N2O emission from Danish WWTPs.
To quantify the N2O emission from Danish WWTPs, the Danish Environmental Protection Agency (EPA) launched a funding scheme aimed at Danish utilities to collect data on N2O emissions. In the period 2018-2020, nine different plants monitored the N2O emission. The nine WWTPs cover a range in terms of plant size, nitrogen load, aeration technology, sludge treatment, and reject water handling.

Continuous, real-time N2O measurements
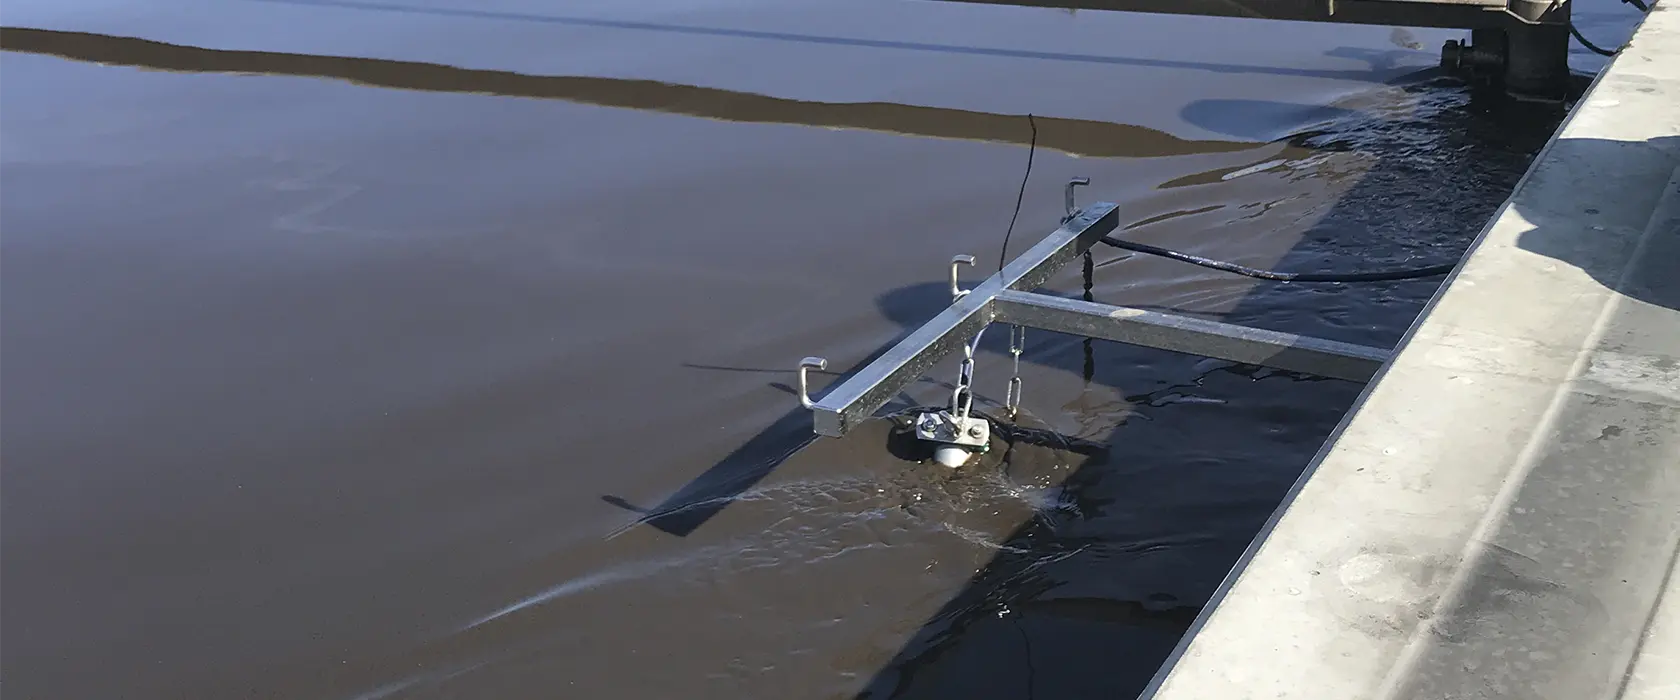
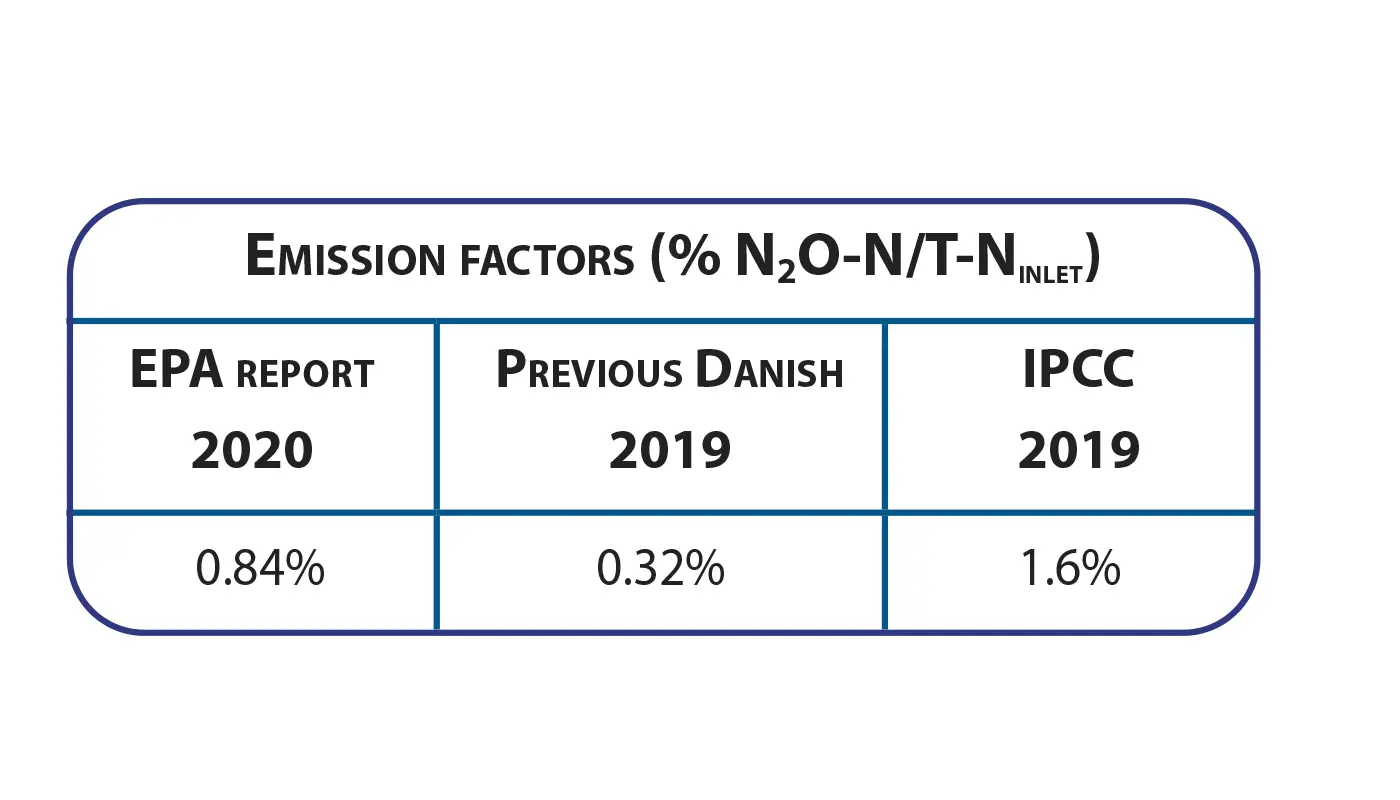
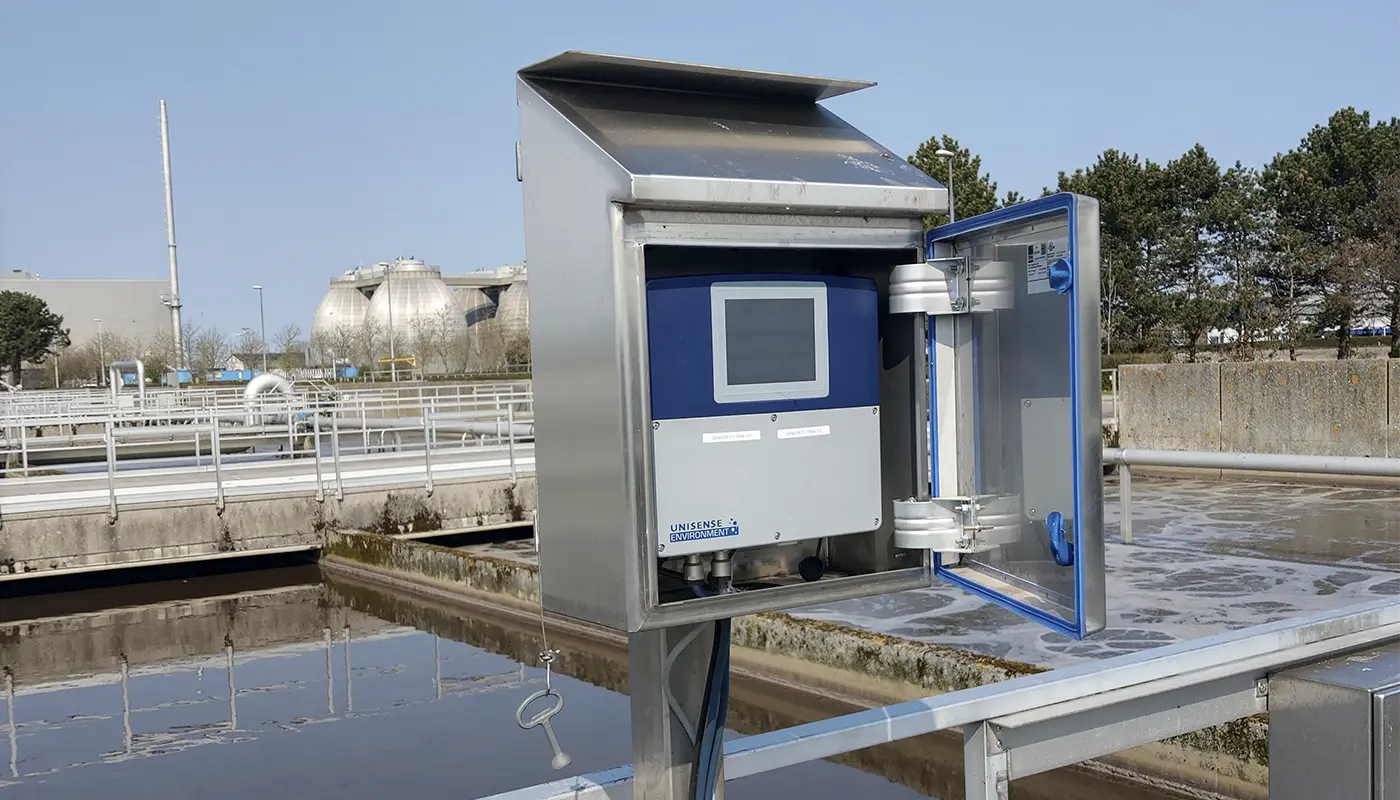
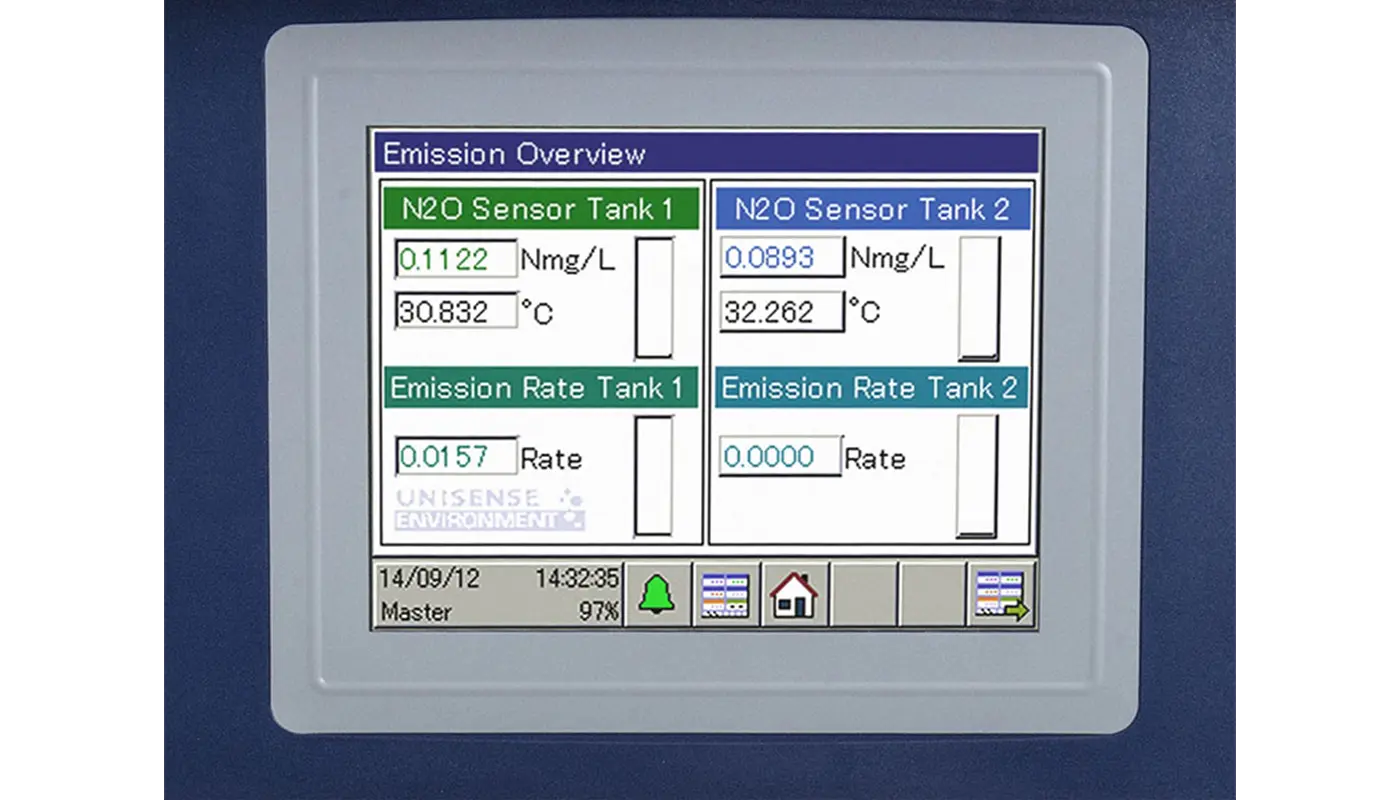
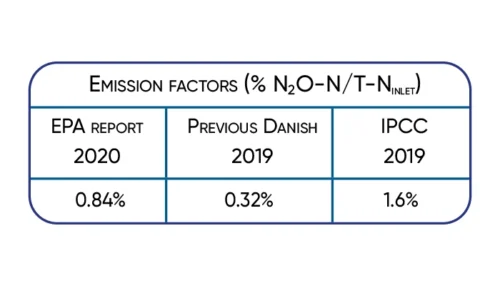
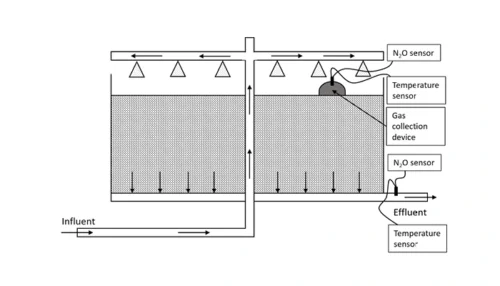
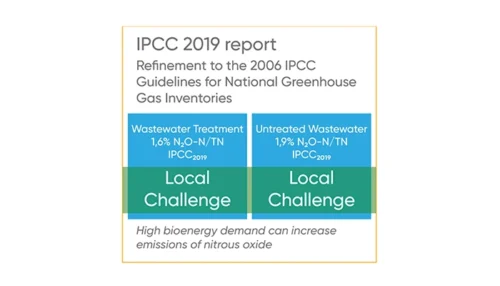
All nine WWTPs installed Unisense Environment N2O Wastewater Sensors to provide continuous, real-time measurements of N2O concentration directly in the wastewater. The data collected using the N2O sensors were subsequently used for calculating N2O emissions using N2O emission models. The emission data were used to calculate an overall average national emission factor: 0.84% N2O-N/Total-Ninlet. This corresponds to 0.0084 kg N2O-N/kg Total-Ninlet with a variation of 0.24–1.24% N2O-N/Total-Ninlet. This is about half of the 1.6% N2O-N/T-Ninlet emission factor used in the IPCC report from 2019, but the previous reported national emission factor is about 2.5 times higher.
The emission factor calculated from this study will be used as a basis for future inventories, because it is based on the most comprehensive dataset yet. The calculated emission factor represents an estimate and should be adjusted when further data become available.
Variations in individual measurements
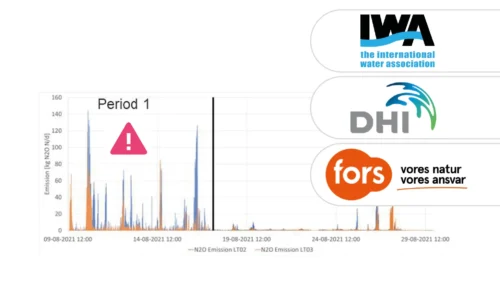
The study showed a large variation in N2O emission from plant to plant and in day-to-day emissions from individual plants. The data indicate that increased nitrogen load and a generally highly loaded biological process lead to higher N2O emissions compared to lower loaded biological processes.
Anammox sidestream processes have high nitrogen loading and nitrogen removal rates. This study found an emission factor of 5–6% N2O-N/Total-Ninlet, which is significantly higher than the average emission factor found for mainstream processes. Furthermore, this study indicated that there was a relationship between the residual available capacity in the biological treatment and the amount of nitrous oxide emitted, where a larger capacity emits less N2O.
Large potential in the reduction of N2O emissions
This study offers indications of mechanisms leading to increased N2O emissions. However, the data show that ammonium loading, carbon loading, and aeration are important factors for N2O emissions. Online monitoring should be implemented to understand N2O emissions and to implement online control strategies. In Denmark, it will be compulsory by 2025 to reduce greenhouse gas emissions. Limiting N2O emissions from WWTPs will be part of reaching this goal. As most Danish wastewater treatment plants have not taken any steps to reduce emission, the potential for reducing the overall emission is very large. Collecting knowledge on nitrous oxide emission, triggers, and mitigation strategies from national and international projects will contribute to an increased understanding of the subject.
Two liquid phase N2O sensors accurately represent process dynamics and emissions in most common raceway and recirculation reactors.
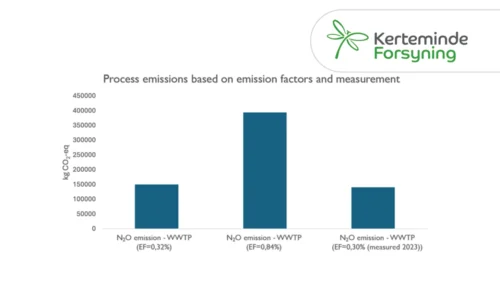
Learn how Kerteminde Forsyning applied nitrous oxide data to reduce the formation of N2O while maintaining low nitrogen emissions
Case Study: Full-scale comparison of N2O emissions determined by liquid sensors and off-gas measurement
Significant 3-fold increase in IPCC2019 wastewater N2O emission factor supported by Danish studies.
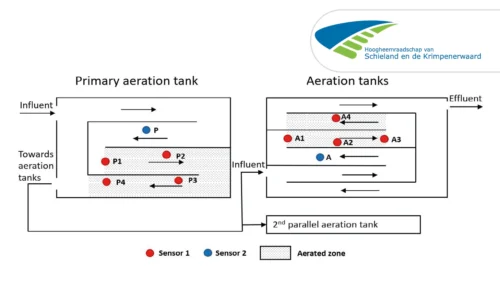
A case study from Kralingseveer WWTP in the Netherlands explores the influence of sensor placement.
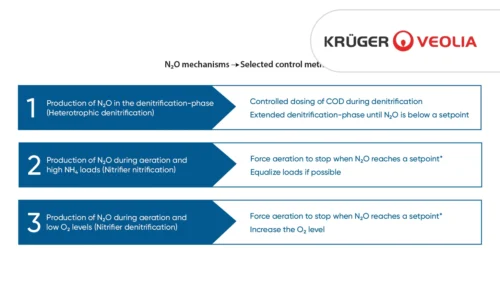
Based on data from Danish WWTPs through advanced online-control.
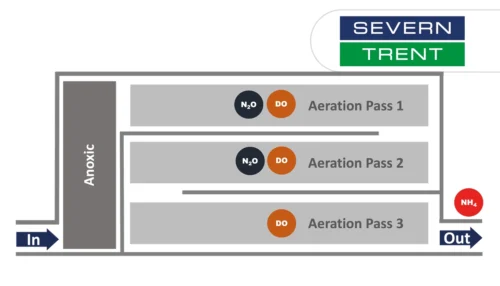
Learn about the results from N2O monitoring in the activated sludge tanks at Severn Trent’s Spernal sewage treatment plant
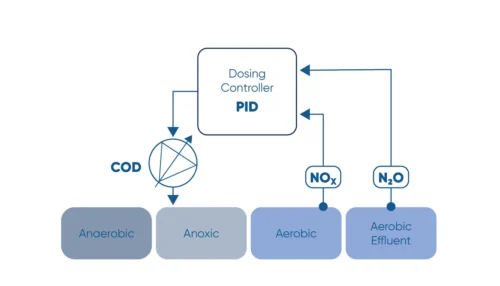
Monitor the N2O concentration in the liquid and use N2O as a control parameter for carbon dosage in the denitrification process.
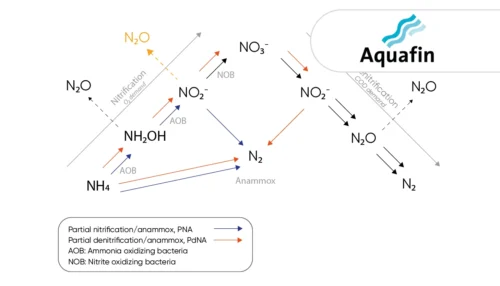
Learn how the water utility Aquafin controls emissions from deammonification processes using the the N2O Wastewater Sensor
Greenhouse gas emissions at wastewater treatment plants are coming into focus as the water industry works to reduce its climate footprint

The investment costs had initially deterred us somewhat. However ...
A study of three very different WWTPs in Denmark: Bjergmarken (125,000 PE), Holbæk (60,000 PE), and Hvalsø (11,570 PE)
The available data show that the nitrous oxide emission varies in time and between wastewater treatment plants.
Information regarding N2O emissions from trickling filters is limited, partly caused by the difficulties in capturing off-gases.
Significant 3-fold increase in IPCC2019 wastewater N2O emission factor supported by Danish studies.