
Shared with permission from Krüger Veolia.
Authors: Ellen Marie Drastrup, Krüger A/S and Jakob Fink, Aarhus University
Introduction
Nitrous oxide (N2O) has been identified as a significant contributor to the water sector’s carbon footprint.
N2O is produced as a byproduct of nitrogen removal in biological wastewater treatment plants (WWTP), and it is therefore obligatory for the water sector to look into this if they want to reduce their carbon footprint.
The scope of this project is to identify different N2O pathways by looking into examples from Danish WWTPs. The design, composition of load and control strategy have a big impact on the N2O production of the specific plant, and will impact which N2O pathway is dominant. Only by data observation and analysis can the correct control method be applied, and N2O reduced.
Due to lack of data from Fornæs WWTP, this poster will use an example from Næstved WWTP.
Methods
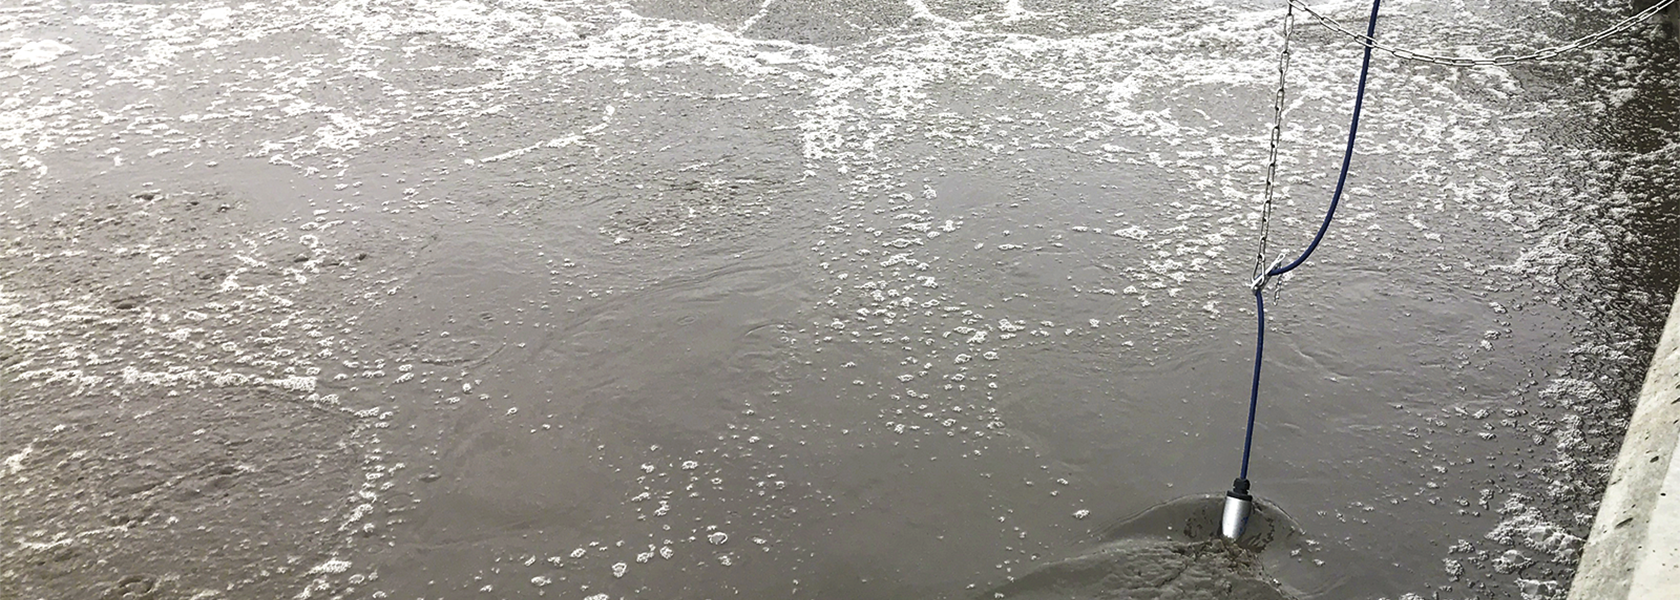
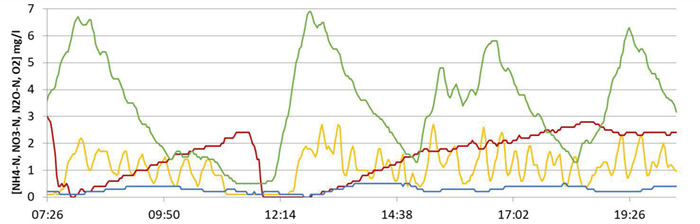
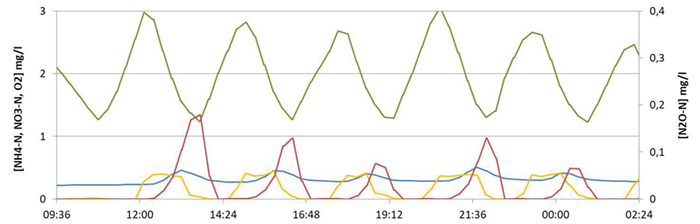
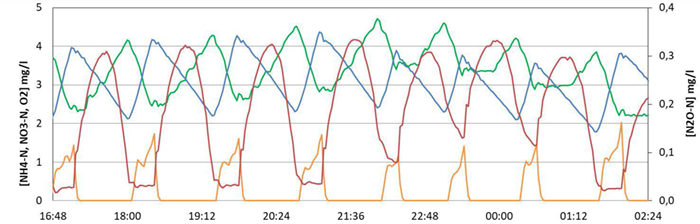
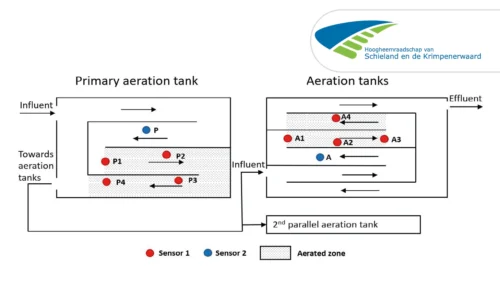
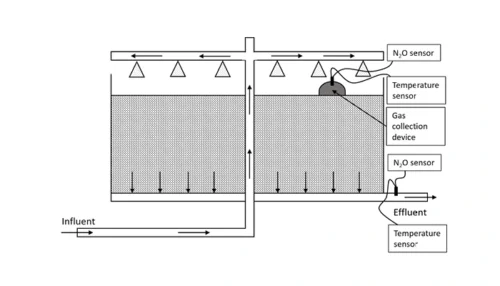
In order to observe how N2O is produced in relation to NH4, NO3 and O2-levels, it is crucial to have online sensors in the water phase. Most Danish WWTPs already have online NH4,
NO3 and O2 sensors in order to observe and control the nitrogen removal processes. Next step has been to install N2O-online sensor in the water phase.
By being part of many N2O measuring projects, we have had the opportunity to gather knowledge from a broad range of Danish WWTPs. Here examples from 4 WWTPs is shown.
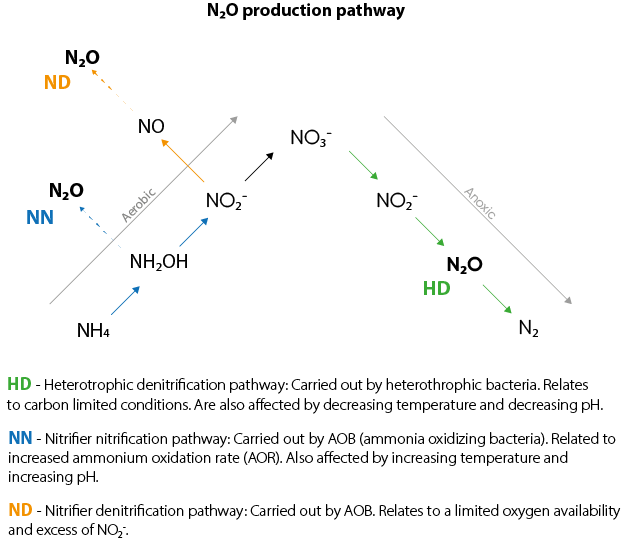
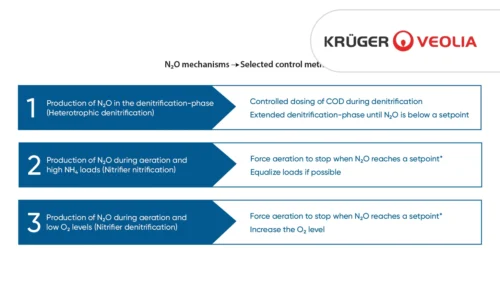
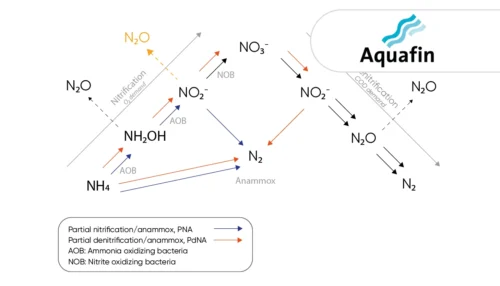
N2O is produced through three different pathways during nitrification (N) and denitrification (DN). It varies a lot from plant to plant which pathway is dominant, and what N2O-pattern we see in the online data. It is not always clear which pathway that is dominant or the reason for a high N2O.
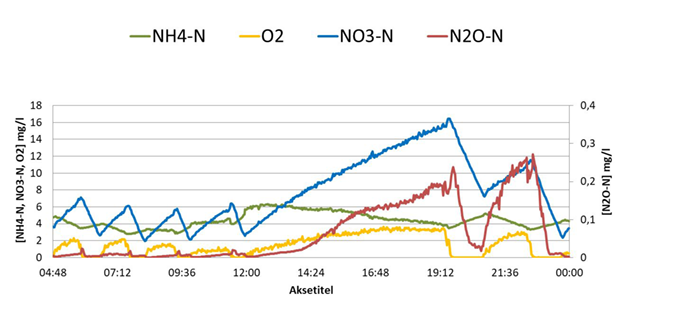
To try to understand the N2O-production at each plant, we have looked into the data, and observed how NH4, NO3, O2 and N2O relates. That requires qualitative analyses of the figures of measured data. When the dominant pathway has been identified it is possible to suggest a control method.
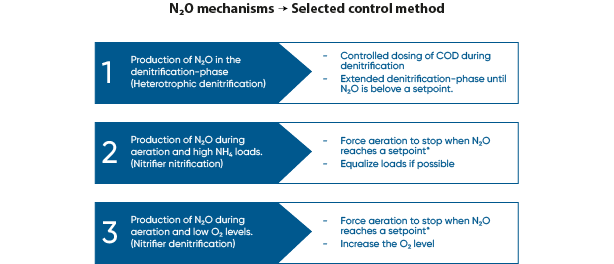
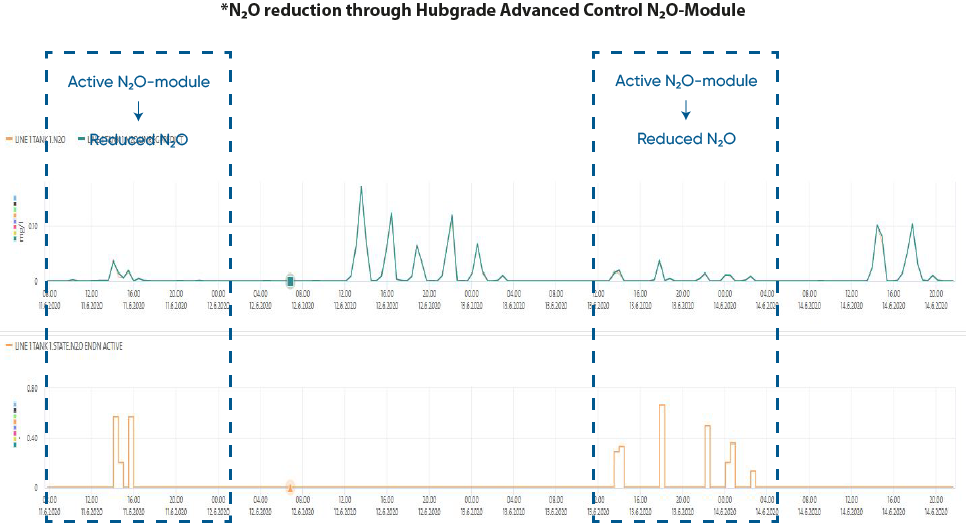
Based on literature and in-situ experience, three N2O control methods have been selected.
Results & Discussion
In order to take action on N2O reduction, the following method has been identified:
- Go through your treatment plant in order to find the relevant process tanks, where nitrogen removal takes place
- Install N2O sensor in the process tank
- Observe the pattern of N2O production
- Select the control strategy based on the observed N2O mechanism
- Implement the control strategy through advanced online control
- Evaluate the N2O reduction and reconsider
Click the image to the right for more results and for information on location and control method.
Conclusions
N2O plays a major part in wastewater treatment plants' climate impact and it is crucial to look into this challenge for all plants in order to tackle it. In order to reduce N2O, the first step is to gain knowledge of the amounts and the pattern of production, in order to interpret the biological pathways. When you have this knowledge, you can choose the best control method and start reducing the emission.
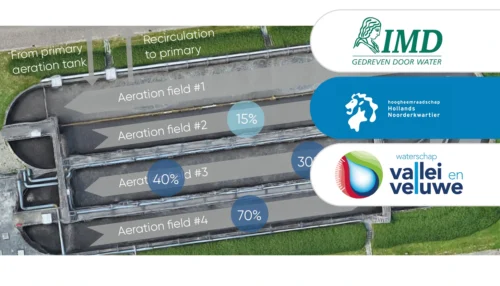
Two liquid phase N2O sensors accurately represent process dynamics and emissions in most common raceway and recirculation reactors.
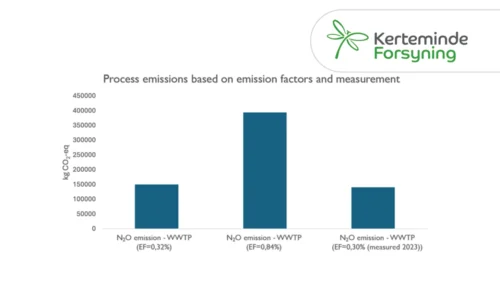
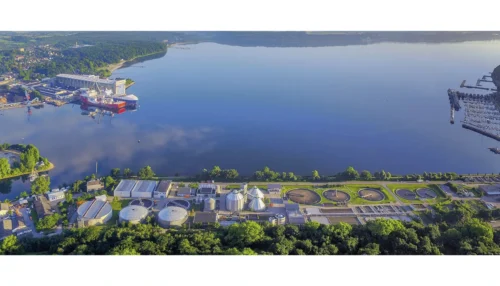
Learn how Kerteminde Forsyning applied nitrous oxide data to reduce the formation of N2O while maintaining low nitrogen emissions
Case Study: Full-scale comparison of N2O emissions determined by liquid sensors and off-gas measurement
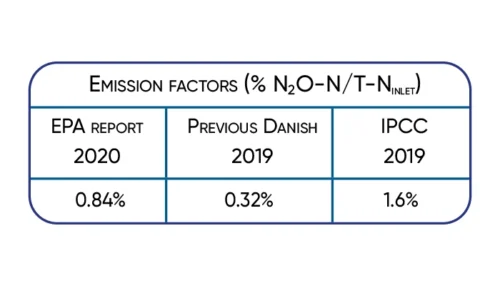
Significant 3-fold increase in IPCC2019 wastewater N2O emission factor supported by Danish studies.
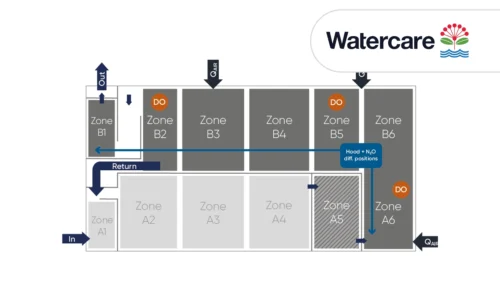
A case study from Kralingseveer WWTP in the Netherlands explores the influence of sensor placement.
Based on data from Danish WWTPs through advanced online-control.
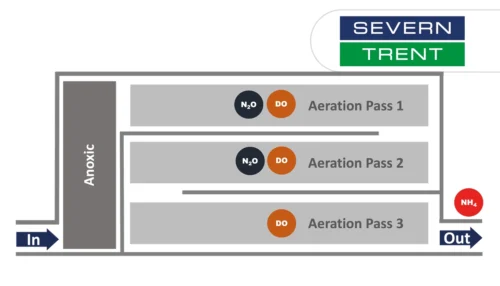
Learn about the results from N2O monitoring in the activated sludge tanks at Severn Trent’s Spernal sewage treatment plant
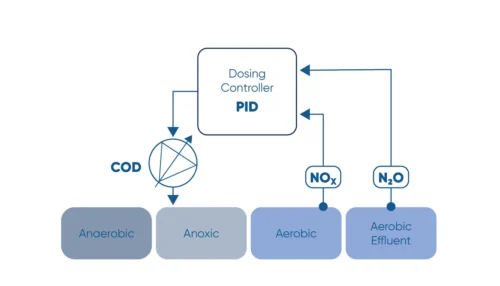
Monitor the N2O concentration in the liquid and use N2O as a control parameter for carbon dosage in the denitrification process.
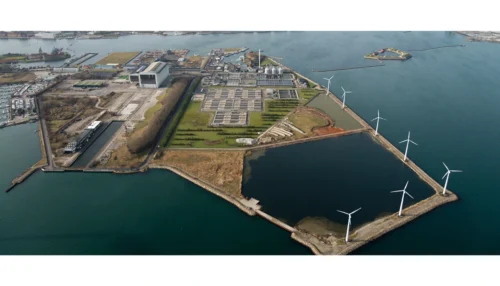
Learn how the water utility Aquafin controls emissions from deammonification processes using the the N2O Wastewater Sensor
Greenhouse gas emissions at wastewater treatment plants are coming into focus as the water industry works to reduce its climate footprint
The investment costs had initially deterred us somewhat. However ...
A study of three very different WWTPs in Denmark: Bjergmarken (125,000 PE), Holbæk (60,000 PE), and Hvalsø (11,570 PE)
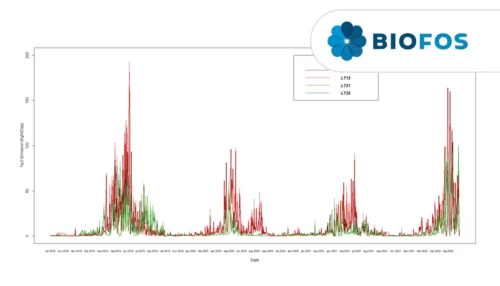
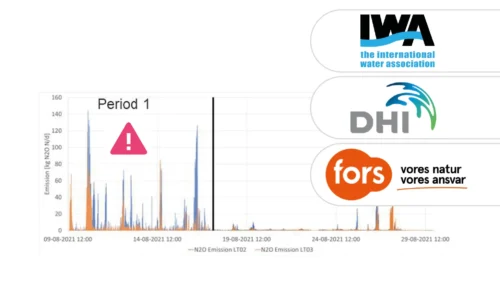
The available data show that the nitrous oxide emission varies in time and between wastewater treatment plants.
Information regarding N2O emissions from trickling filters is limited, partly caused by the difficulties in capturing off-gases.
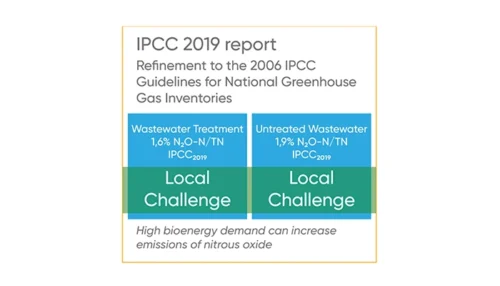
Significant 3-fold increase in IPCC2019 wastewater N2O emission factor supported by Danish studies.