
Case Study: Influence of positioning of N2O Wastewater Sensors
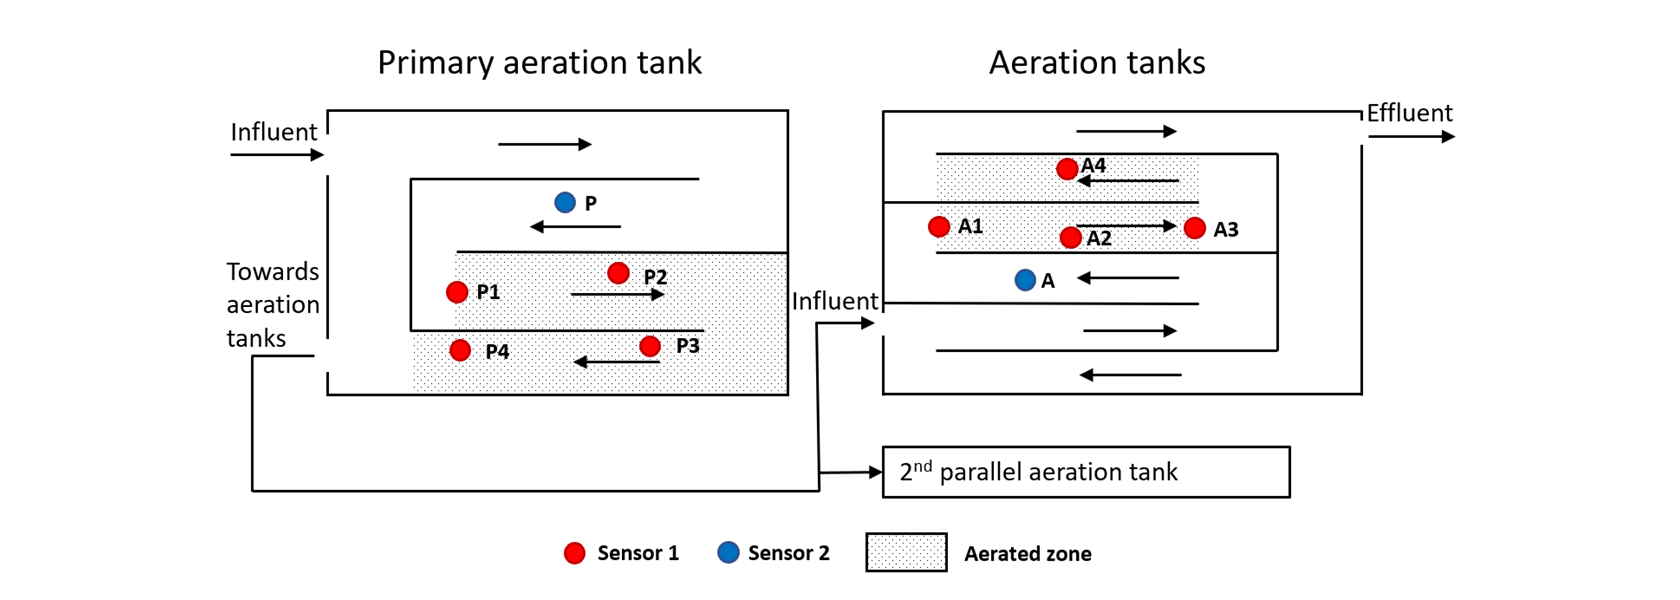
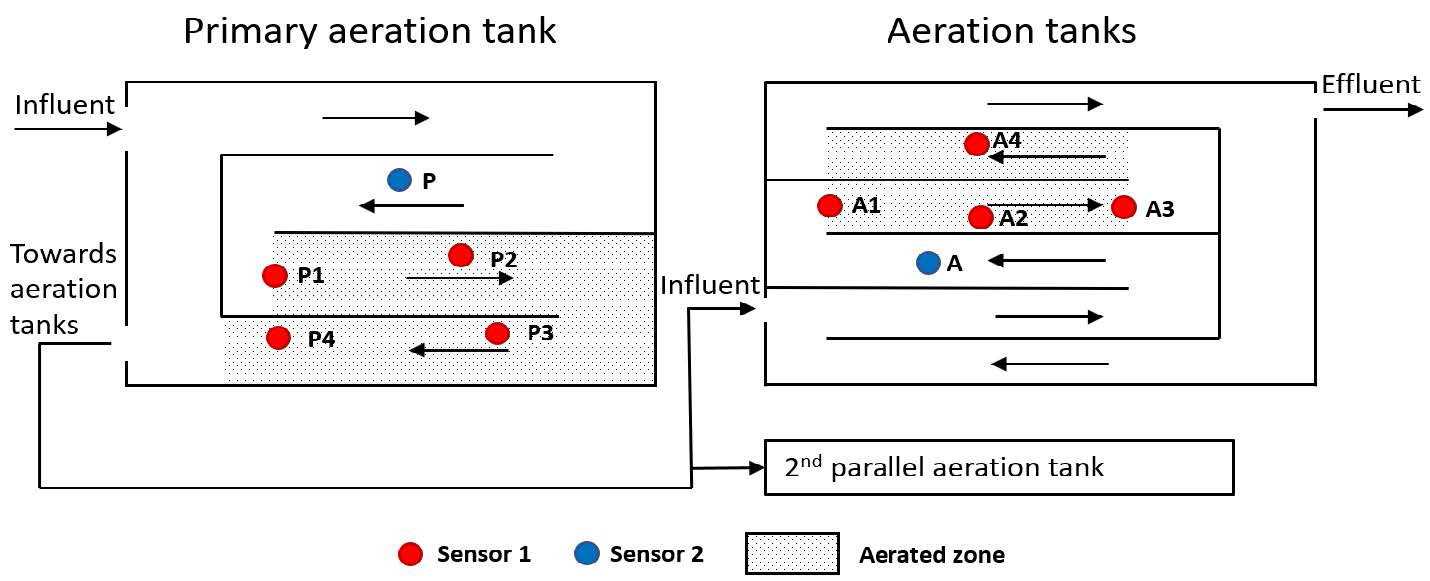
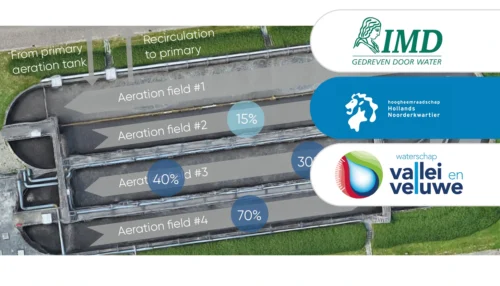
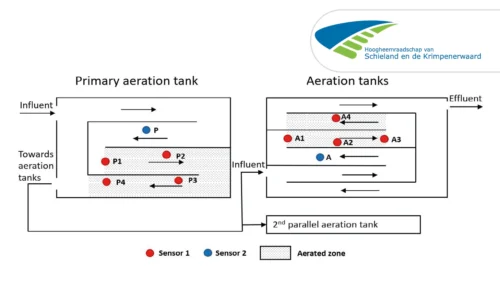
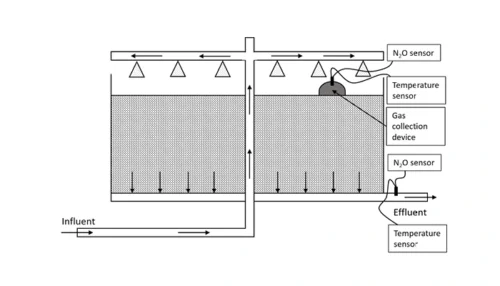
Kralingseveer WWTP implemented N2O monitoring in their aeration tanks. One sensor was placed in the aerated zone, and another was placed in the unaerated zone at each compartment (Fig. 1). N2O emissions predominantly occur in aerated zones due to air stripping, and the N2O emission was assumed to be more variable in the aerated zone compared to the unaerated zone. To quantify and understand the variation in N2O emissions in the aerated zone, the WWTP monitored various spots within the aerated zone for a week. Meanwhile, they kept the sensor in the unaerated zone in the same position (Fig. 1).
Scounting Campaign to Identify Sensor Placements
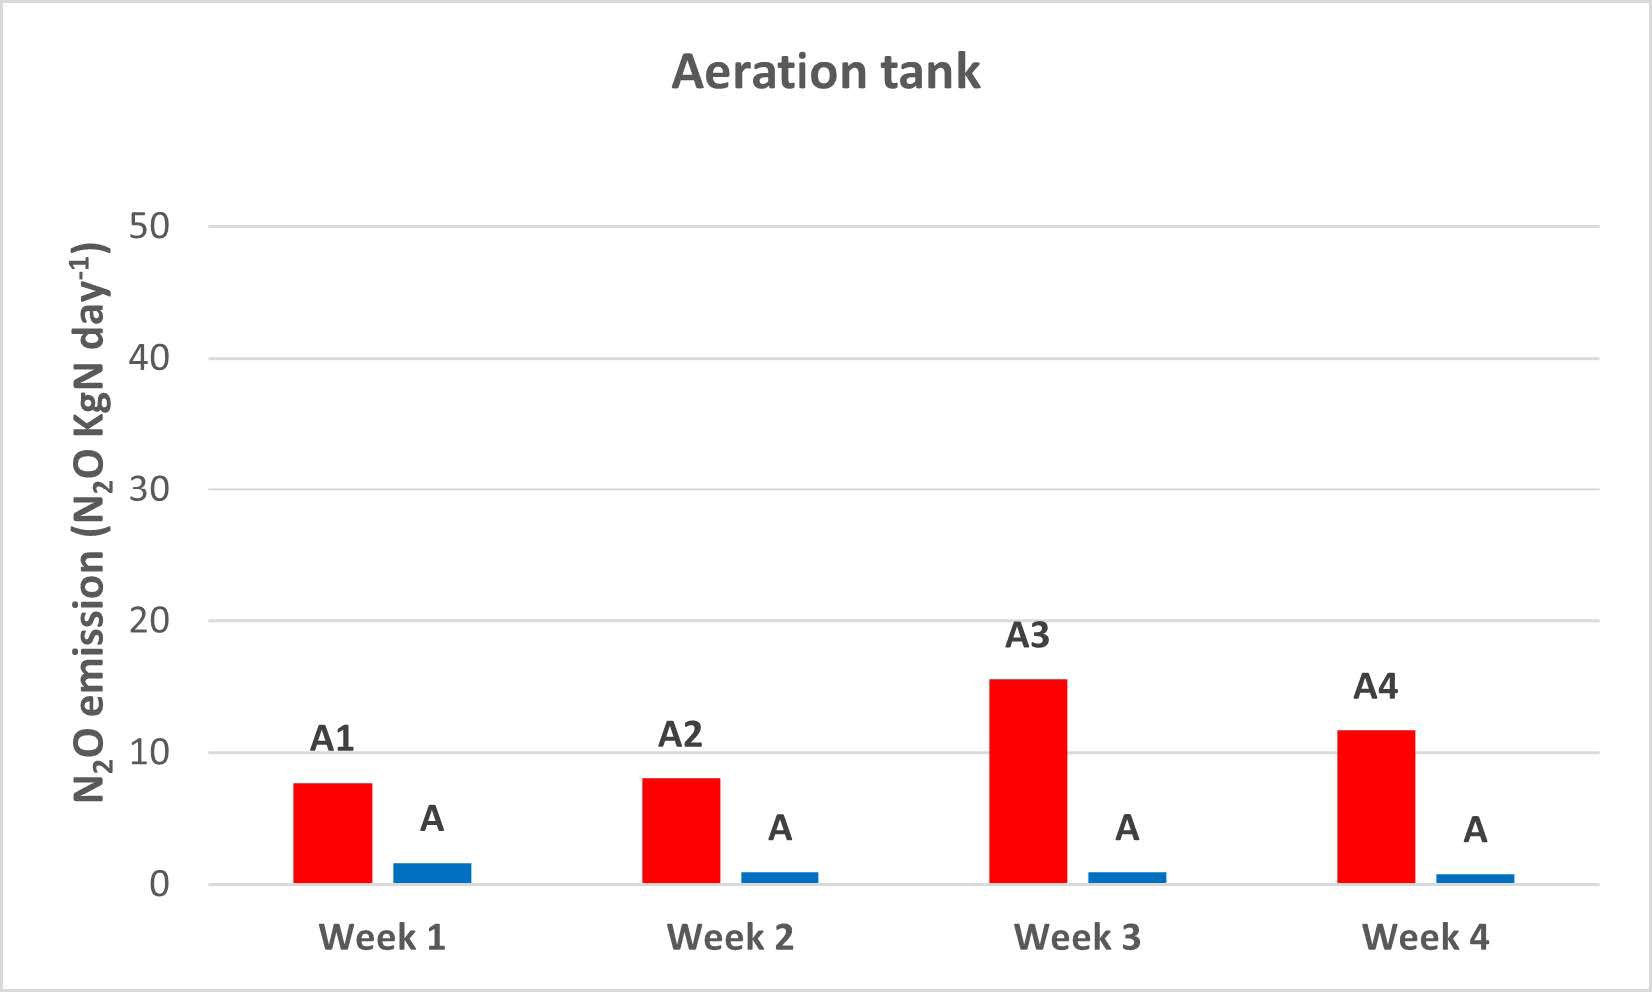
The WWTP chose the best representing spots by monitoring four different spots from the beginning to the end of the aerated zone in both the primary aeration tank and the aeration tank. Monitoring showed that N2O emissions were highest at the beginning of the aerated zone and lowest at the end (Fig. 2A). In the aerated tank, they observed that the N2O emission was highest in the second half of the aerated zone (Fig. 2B). Overall, emission was higher in the aerated zone compared to the unaerated zone.
The scouting campaign led to a position representing an average value for long term monitoring in each aerated zone. In the primary aeration tank, they chose a position between P2 and P3, and a position between A2 and A3 in the aeration tank.
The Aerated Zone Accounted for about 90% of N2O Emissions
The primary aeration tank with a higher load produced higher N2O emission compared to the secondary aeration tanks. In both sections, the N2O emissions were higher in the aerated zone and accounted for about 90% of the N2O emissions, highlighting the importance of focusing on the aerated zone. The scouting campaign showed that the position of the N2O Wastewater Sensor in the aerated zone yielded differences in the measured N2O emissions. Ideally, it would be useful to have one sensor as a reference sensor when another sensor changes position.
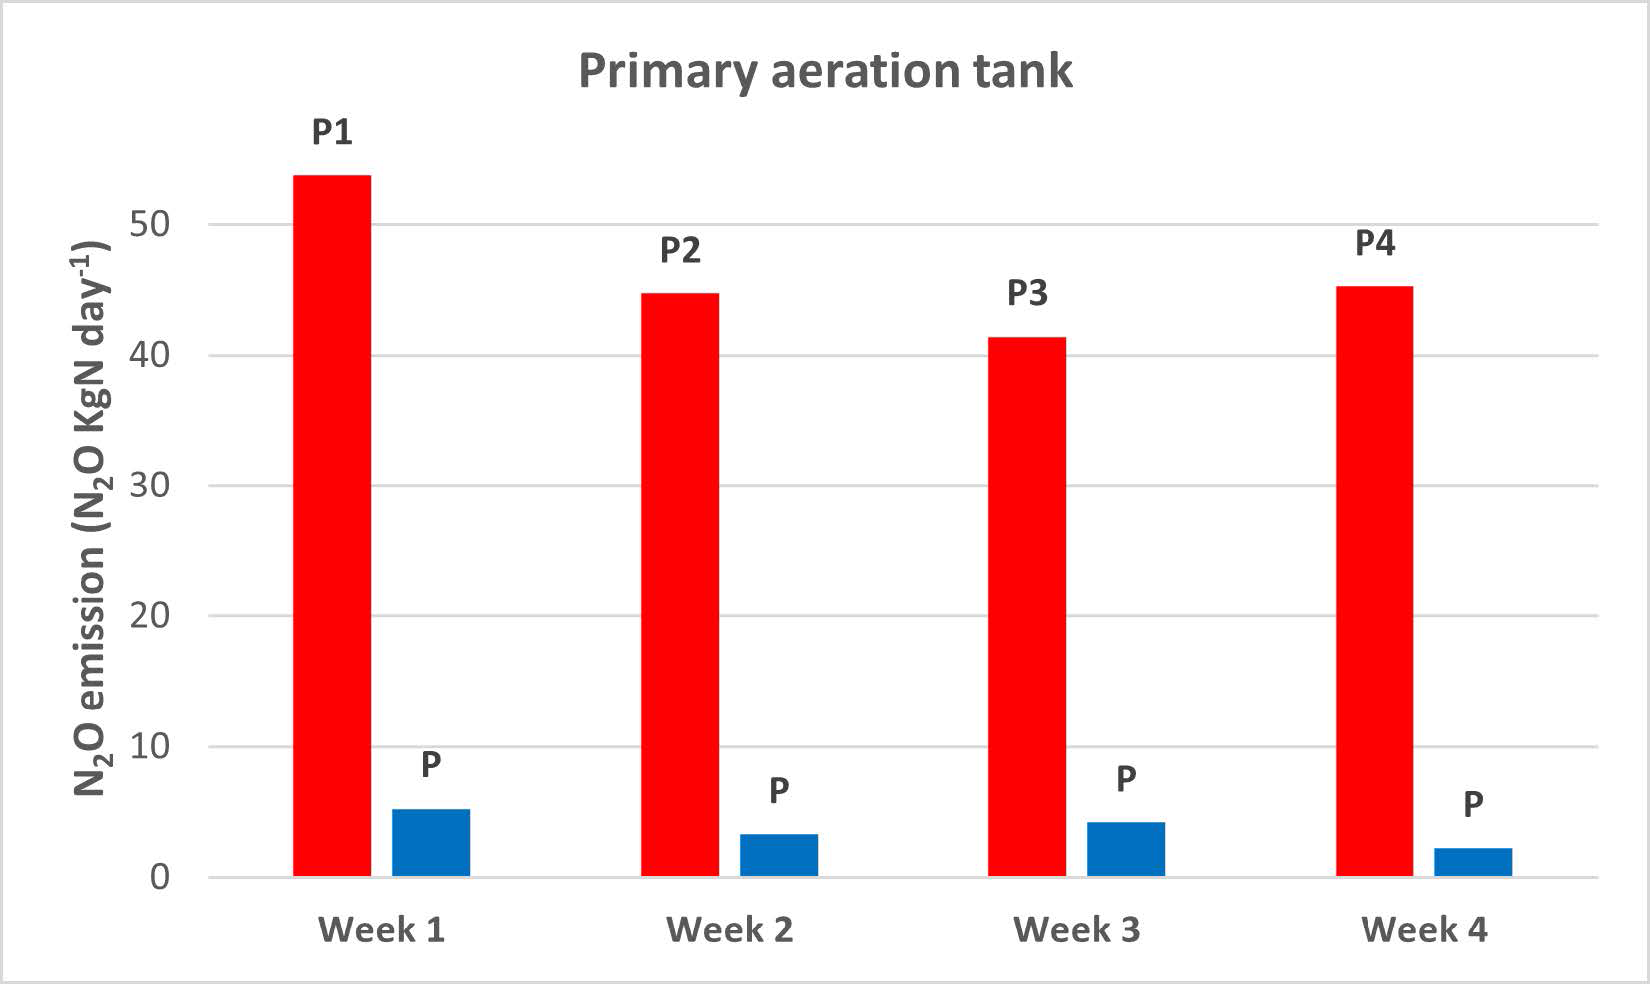
The N2O emissions varied by only 23% in the primary tank, and all positions provided a good estimate of the N2O emission. However, the variation in the aeration tank was higher (50%), and the trend of increasing emission towards the end of the aerated zone could indicate a COD limitation, which has been shown to increase N2O emission. In that case, a representative position needs to be more carefully selected. Learn more in our technote on carbon dosage.
Two liquid phase N2O sensors accurately represent process dynamics and emissions in most common raceway and recirculation reactors.
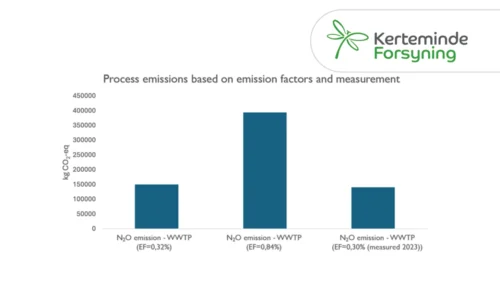
Learn how Kerteminde Forsyning applied nitrous oxide data to reduce the formation of N2O while maintaining low nitrogen emissions
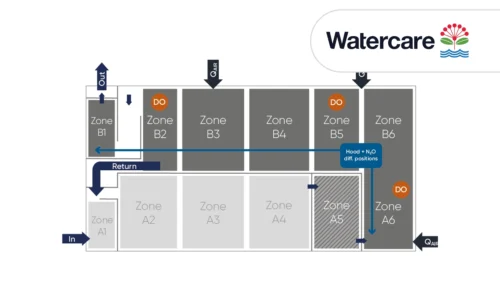
Case Study: Full-scale comparison of N2O emissions determined by liquid sensors and off-gas measurement
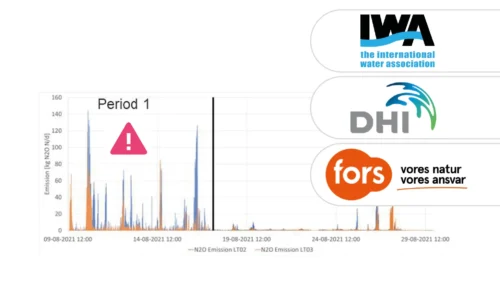
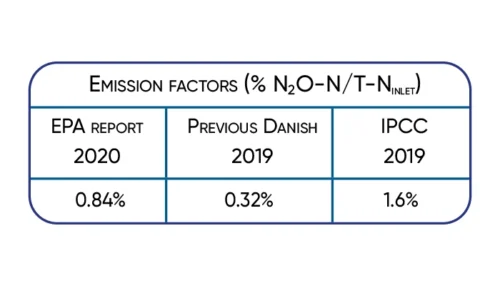
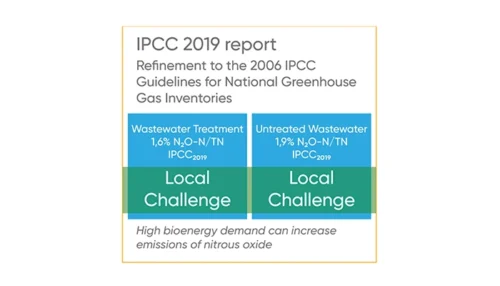
Significant 3-fold increase in IPCC2019 wastewater N2O emission factor supported by Danish studies.
A case study from Kralingseveer WWTP in the Netherlands explores the influence of sensor placement.
Based on data from Danish WWTPs through advanced online-control.
Learn about the results from N2O monitoring in the activated sludge tanks at Severn Trent’s Spernal sewage treatment plant
Monitor the N2O concentration in the liquid and use N2O as a control parameter for carbon dosage in the denitrification process.
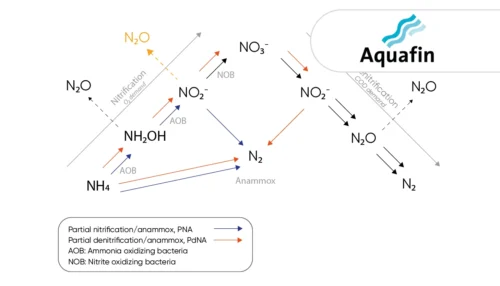
Learn how the water utility Aquafin controls emissions from deammonification processes using the the N2O Wastewater Sensor

Greenhouse gas emissions at wastewater treatment plants are coming into focus as the water industry works to reduce its climate footprint

The investment costs had initially deterred us somewhat. However ...
A study of three very different WWTPs in Denmark: Bjergmarken (125,000 PE), Holbæk (60,000 PE), and Hvalsø (11,570 PE)
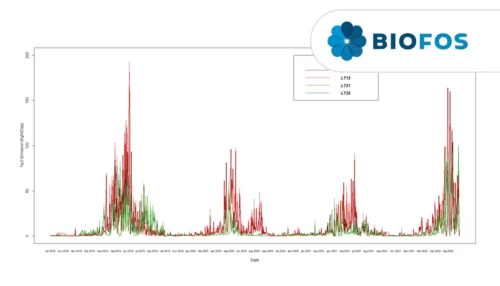
The available data show that the nitrous oxide emission varies in time and between wastewater treatment plants.
Information regarding N2O emissions from trickling filters is limited, partly caused by the difficulties in capturing off-gases.
Significant 3-fold increase in IPCC2019 wastewater N2O emission factor supported by Danish studies.