
Spernal, Severn Trent’s Resource Recovery and Innovation Centre
Severn Trent is the UK’s second biggest water company, serving 4.4 million private and business customers in England and Wales. Spernal STW is a medium sized sewage treatment works in Warwickshire with a dry weather flow capacity of 27,760 m3/day. With a discharge consent on ammonia, and resulting focus on nitrification in nitrogen treatment, it is a typical site for the UK and other parts of the world.
Spernal Sewage Treatment Works serves as Severn Trent’s “Urban Strategy Demonstration Site”, where emerging technologies that are compatible with a low energy, circular economy approach are being evaluated. As such, it was Severn Trent’s first site to be equipped with dissolved nitrous oxide sensors. The goal of installing the sensors was to gain a better understanding of the site’s scope 1 climate impact and the potential for reducing emission by means of process optimizations. While this study shows a short period of data collection, long term monitoring is implemented to fully understand GHG emissions and triggers for N2O formation.
Case Study: Nitrous Oxide Monitoring in a Typical Nitrifying Activated Sludge Process
N2O Monitoring in the Activated Sludge Tanks
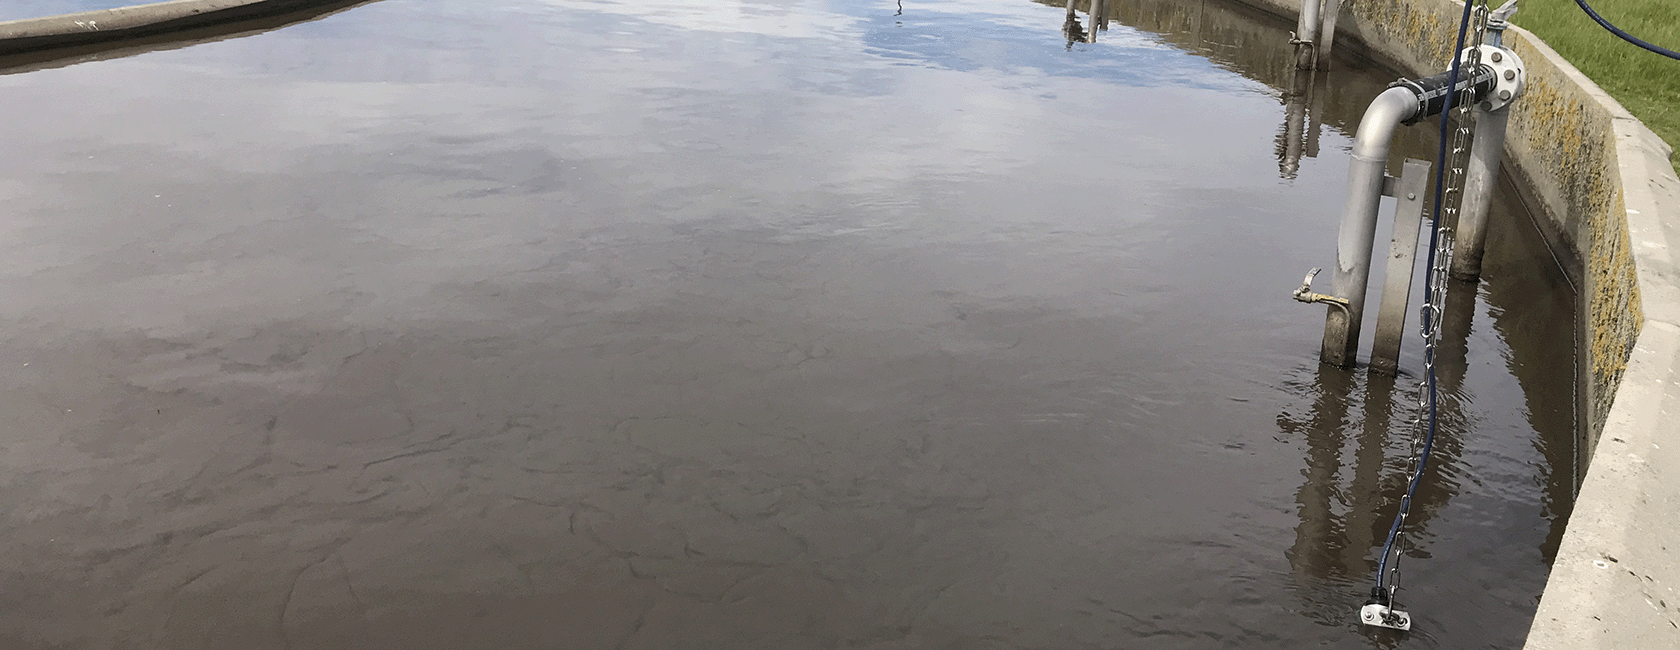
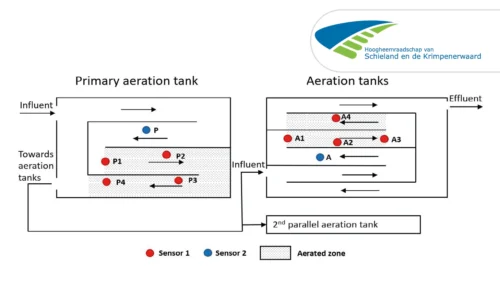
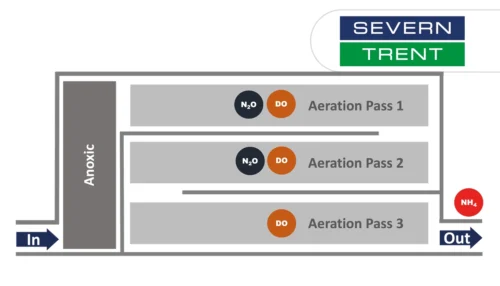
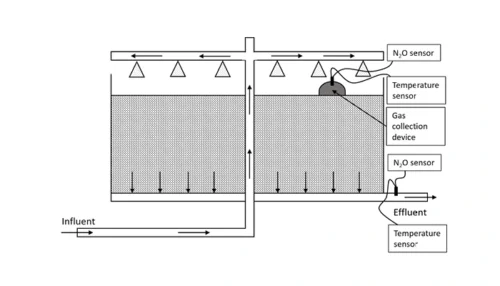
The activated sludge lanes at Spernal are divided into a short anoxic zone followed by 3-pass aerated zones (Fig. 1), where most of the nitrification takes place. Severn Trent implemented N2O monitoring in the aerated part of the sludge tanks. The sensors are maintained as part of the site’s regular measuring routine. The two N2O sensors are approx. 25% and 50% into the aerated zone, collocated with DO sensors (Fig. 1). These locations provide a representative value for the emissions of a whole aeration zone. Depending on the layout of the zones and mode of aeration used, a period of scouting with one sensor (while keeping the other in position as reference can be advantageous.
Results from One Month's Data Collection
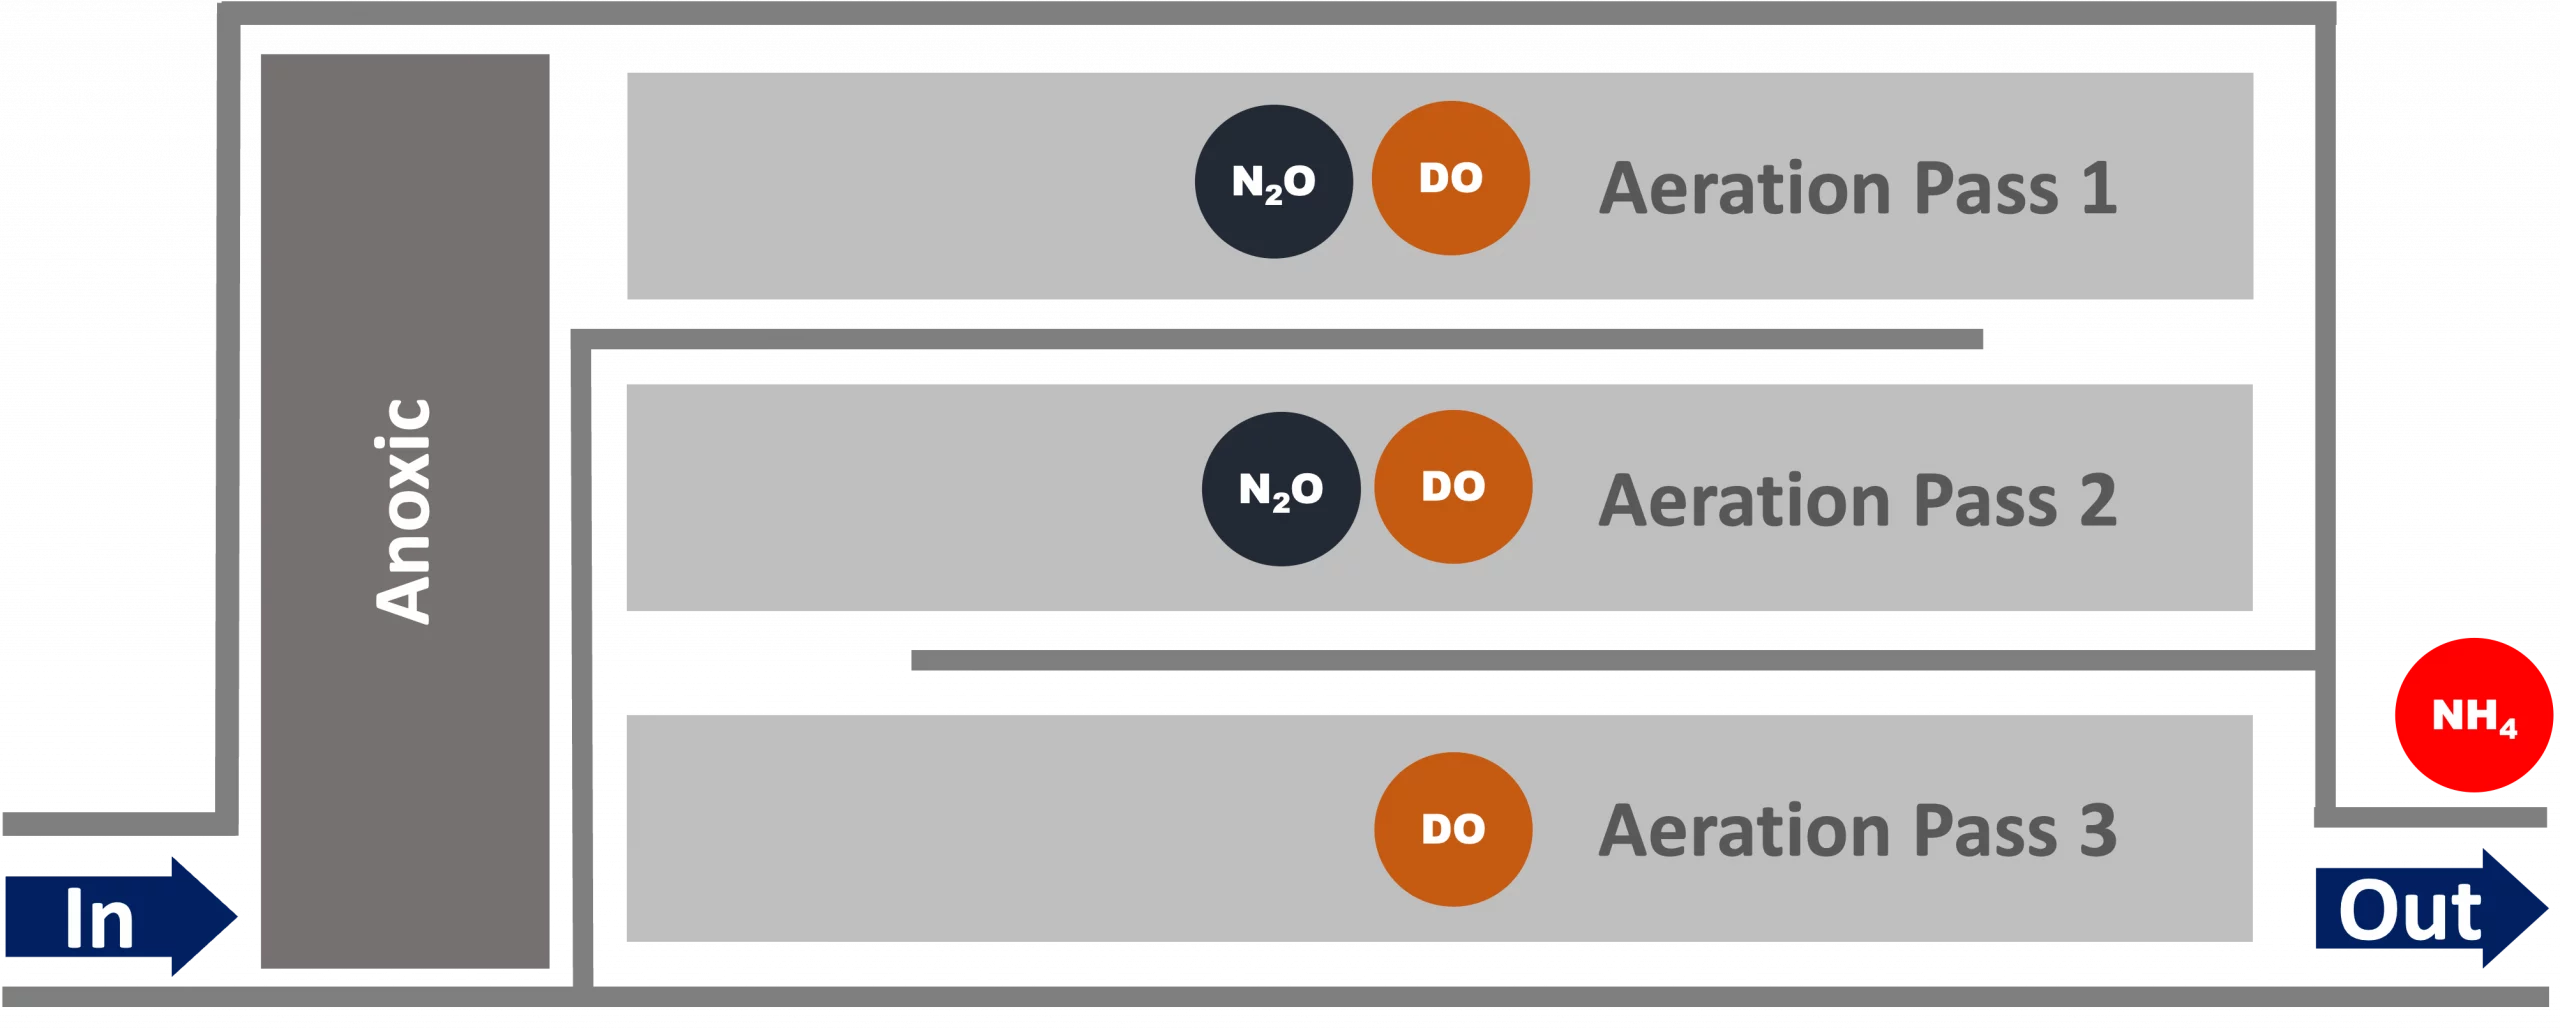
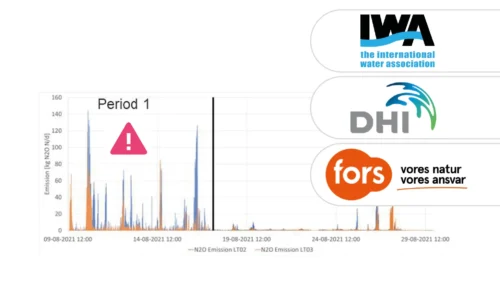
The data discussed here is based on one month’s data collection and is shown in Figure 2. By comparing the measured parameters, it can be concluded that N2O formation is mainly dependent on ammonium loading. During the first 17 days, N2O concentrations were high in both passes, with the highest values in pass 2. This is likely due to an accumulation of nitrites, which coupled with local zones of low oxygen can trigger nitrifier denitrification to produce N2O.
From day 17 onward there is a significant drop in the mean inlet NH4 concentration. Subsequently, N2O concentrations in pass 1 are almost negligible, with lower N2O concentrations in pass 2 as well. With a lower load, the ammonium-based aeration controller safely moves the ammonium load toward the second pass. This results in a slower ammonium turnover and reduced nitrite accumulation. This combination leads to a lower N2O production. The load change is also reflected in the reduced effluent ammonium concentrations (Fig. 2).
Reducing Greenhouse Gas Emissions
After analyzing the data, two potential methods for reducing N2O emissions where identified: The first is to improve load balancing to reduce overloading where possible, while the second is to distribute NH4
turnover throughout the lane by using aeration cascading that relies on N2O sensor input. Continuous monitoring of N2O will help quantify the full extent of scope 1 N2O emissions from this site and validate any
mitigation measures that may be trialed.
Severn Trent has ambitious plans to be at the forefront of the UK Water Sector’s Net Zero initiative and the circular economy. This includes investments in energy savings and energy production as well as advanced nutrient recovery – all while reducing the carbon footprint of their operations. With the implementation of real-time N2O monitoring, Severn Trent is now gathering in-depth knowledge and understanding of their sites’ performance and can realize opportunities to reduce greenhouse gases while optimizing the use of energy and resources to the benefit of their customers and the environment.
Two liquid phase N2O sensors accurately represent process dynamics and emissions in most common raceway and recirculation reactors.
Learn how Kerteminde Forsyning applied nitrous oxide data to reduce the formation of N2O while maintaining low nitrogen emissions
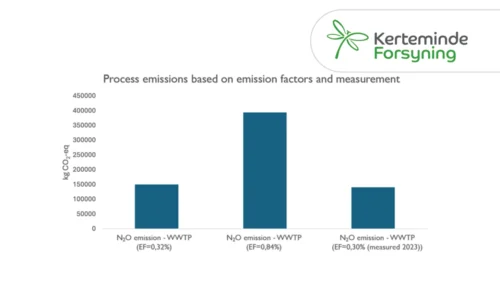
Case Study: Full-scale comparison of N2O emissions determined by liquid sensors and off-gas measurement
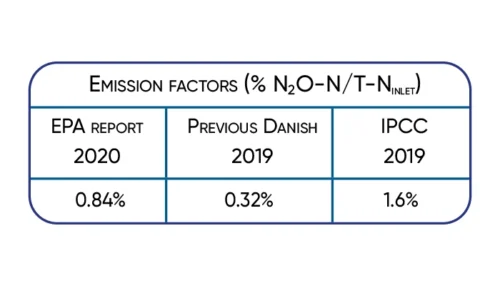
Significant 3-fold increase in IPCC2019 wastewater N2O emission factor supported by Danish studies.
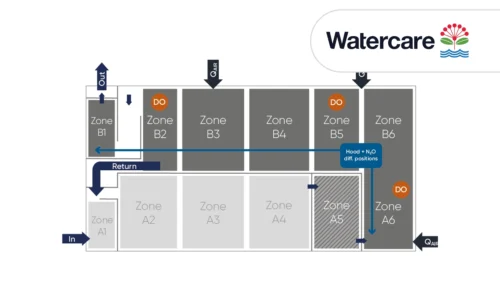
A case study from Kralingseveer WWTP in the Netherlands explores the influence of sensor placement.
Based on data from Danish WWTPs through advanced online-control.
Learn about the results from N2O monitoring in the activated sludge tanks at Severn Trent’s Spernal sewage treatment plant
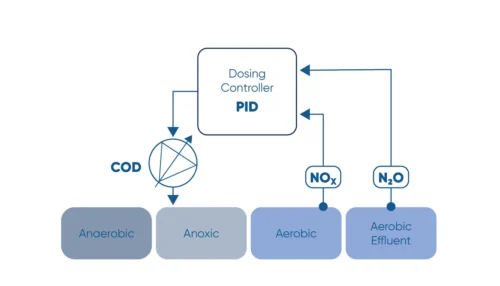
Monitor the N2O concentration in the liquid and use N2O as a control parameter for carbon dosage in the denitrification process.
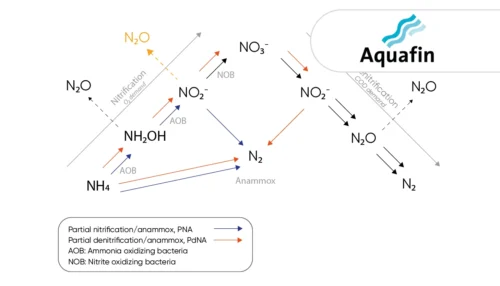
Learn how the water utility Aquafin controls emissions from deammonification processes using the the N2O Wastewater Sensor

Greenhouse gas emissions at wastewater treatment plants are coming into focus as the water industry works to reduce its climate footprint

The investment costs had initially deterred us somewhat. However ...
A study of three very different WWTPs in Denmark: Bjergmarken (125,000 PE), Holbæk (60,000 PE), and Hvalsø (11,570 PE)
The available data show that the nitrous oxide emission varies in time and between wastewater treatment plants.
Information regarding N2O emissions from trickling filters is limited, partly caused by the difficulties in capturing off-gases.
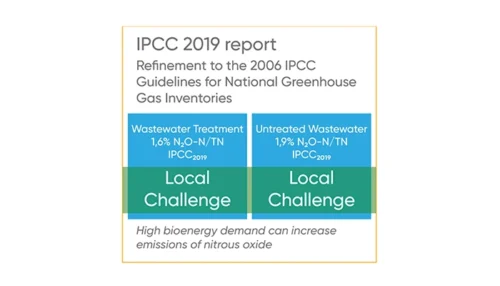
Significant 3-fold increase in IPCC2019 wastewater N2O emission factor supported by Danish studies.