

Case Study: Positioning of N2O sensors in typical biological wastewater treatment processes
Two liquid phase N2O sensors accurately represent process dynamics and emissions in most common raceway and recirculation reactors.
Where to Measure Nitrous Oxide (N2O) Emissions?
This study showed that recirculating reactor types have a homogenous distribution of dissolved N2O in the aerated zone. A single sensor is therefore representative to determine emissions from the whole zone. In the anoxic zone, the potential for loads carried over to the aeration must be monitored at the end of this zone. Deammonification reactors should be considered separately and equipped with specific sensors heads due to their high emission potential.

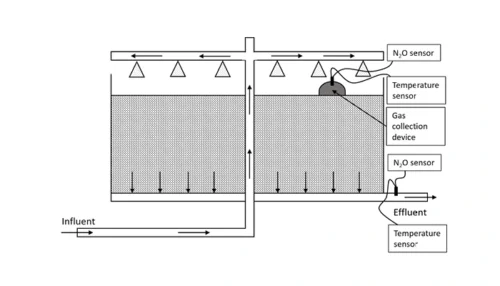
How to Measure N2O in a Recirculation Reactor
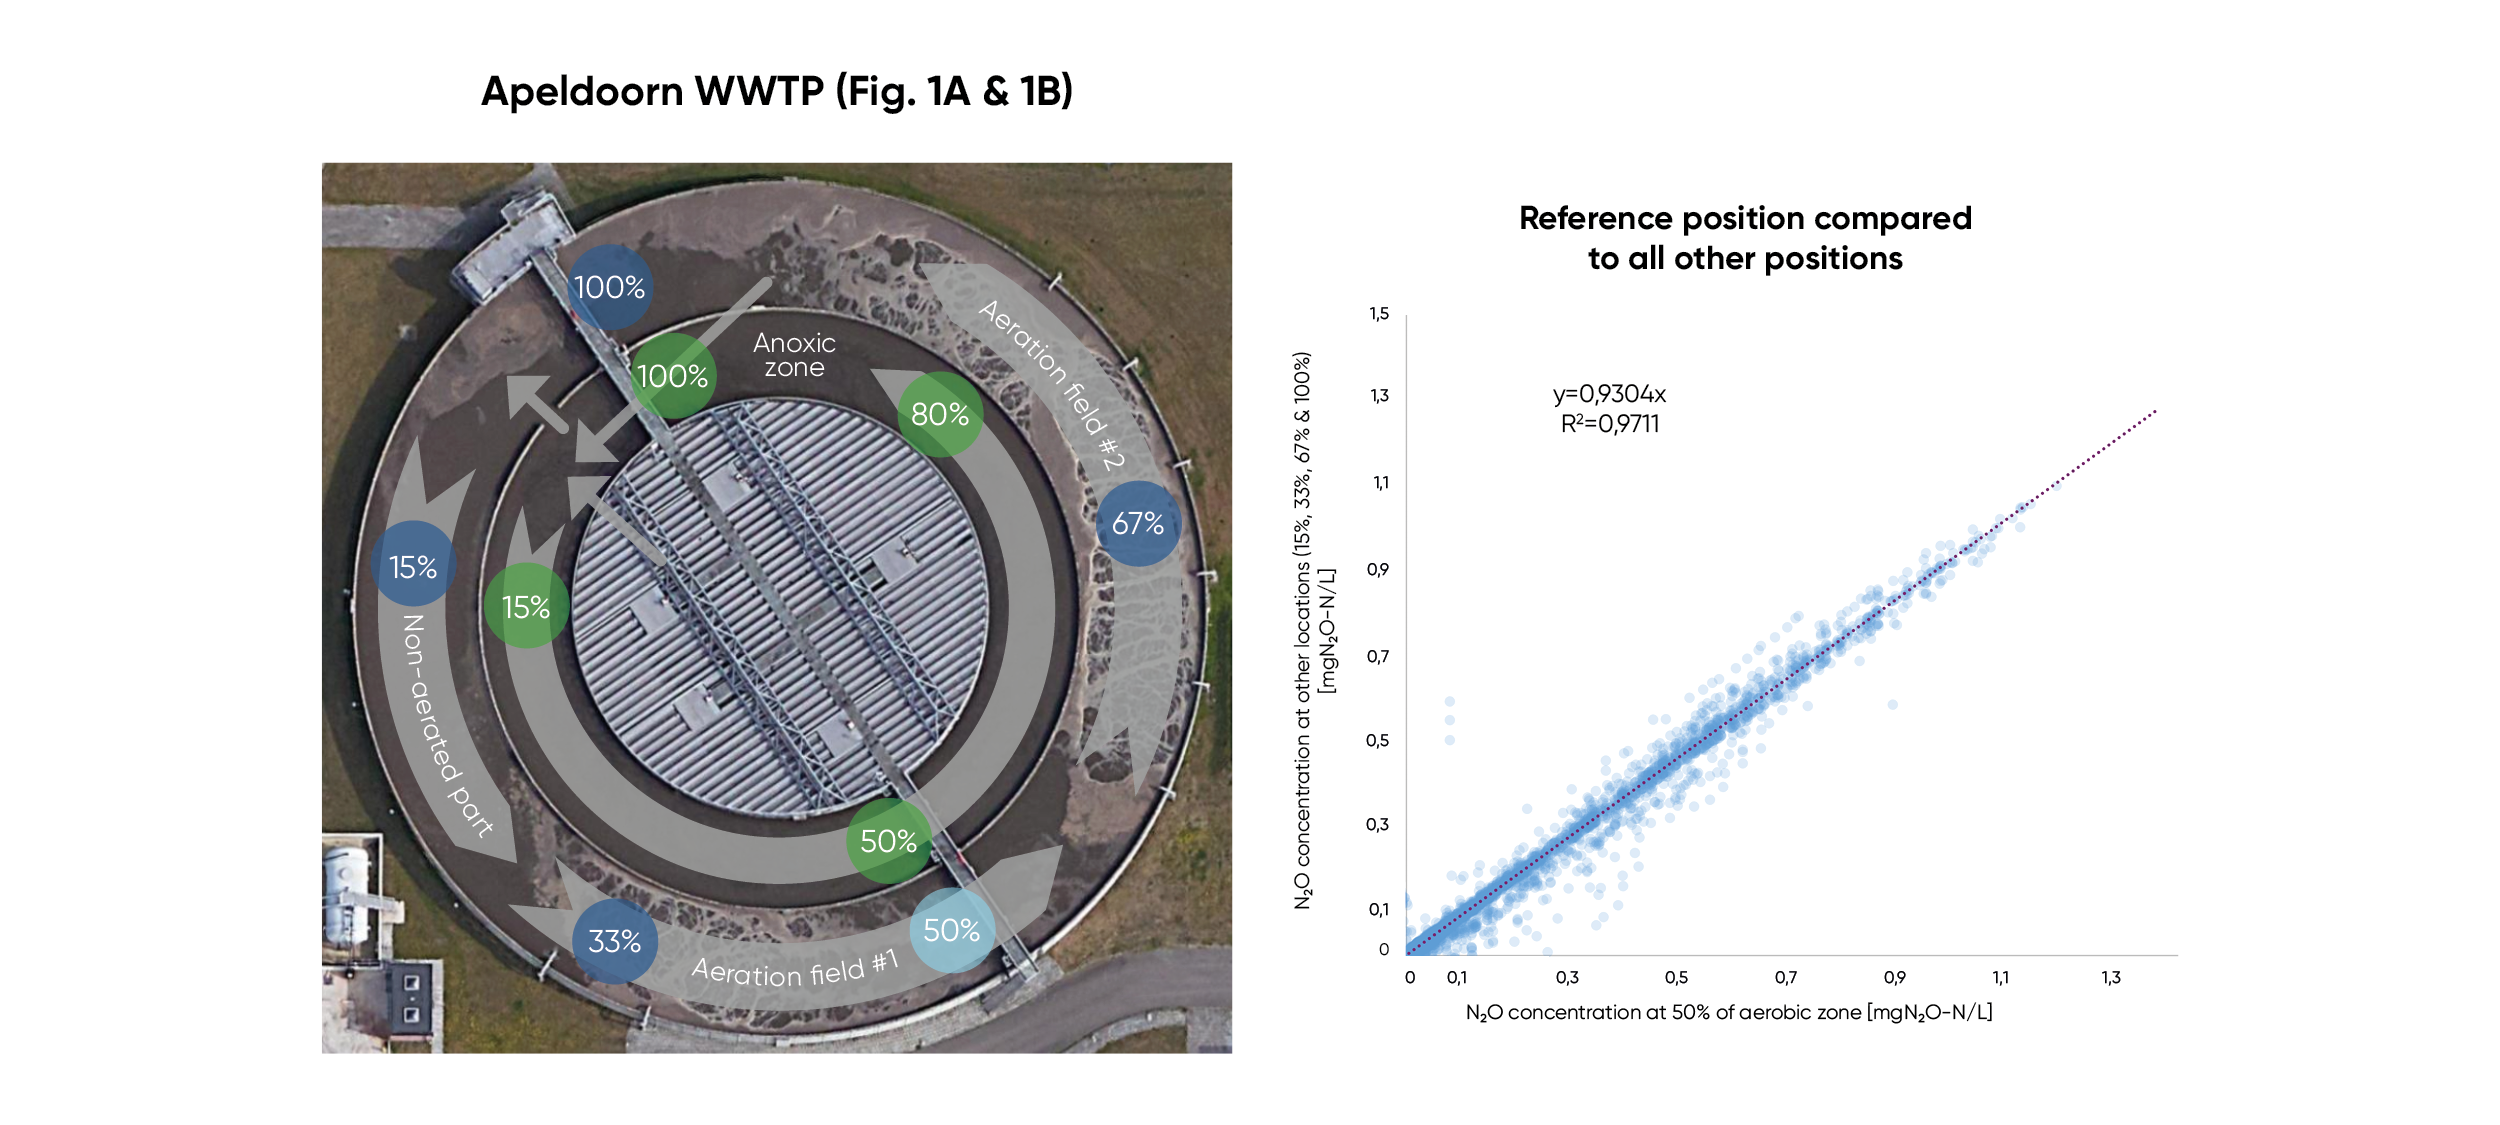
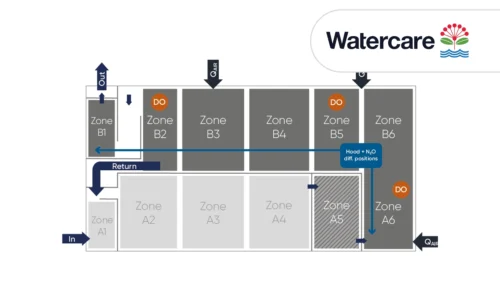
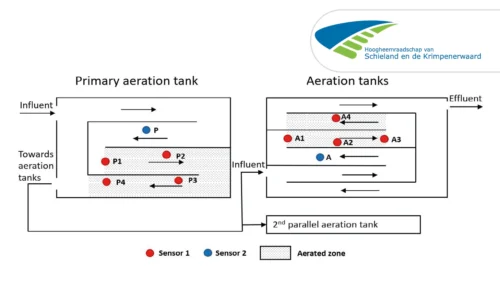
The mUCT reactor investigated here is one of the most widely used reactor types in the Netherlands and many other parts of the world. This recirculation reactor is characterized by two separate ring-shaped treatment zones: An inner anoxic zone and the outer aerobic ring.
Primary Settled wastewater enters the anaerobic selector in the middle, then it flows to the inner anoxic ring. Afterwards it enters the outer ring, which is equipped with 2 separately controlled aeration fields. The flow pattern also includes a reurn of flow from anoxic to the selector as well as from aerobic to anoxic (Fig 1A).
As N2O can be a byproduct of both nitrification and denitrification, it is paramount to measure in both these zones to gain a full understanding of the tank’s N2O production patterns. While most of the emissions take place in the aerated zone by air stripping, diffusion from the anoxic zone can also play a role (emission calculation described in references1).
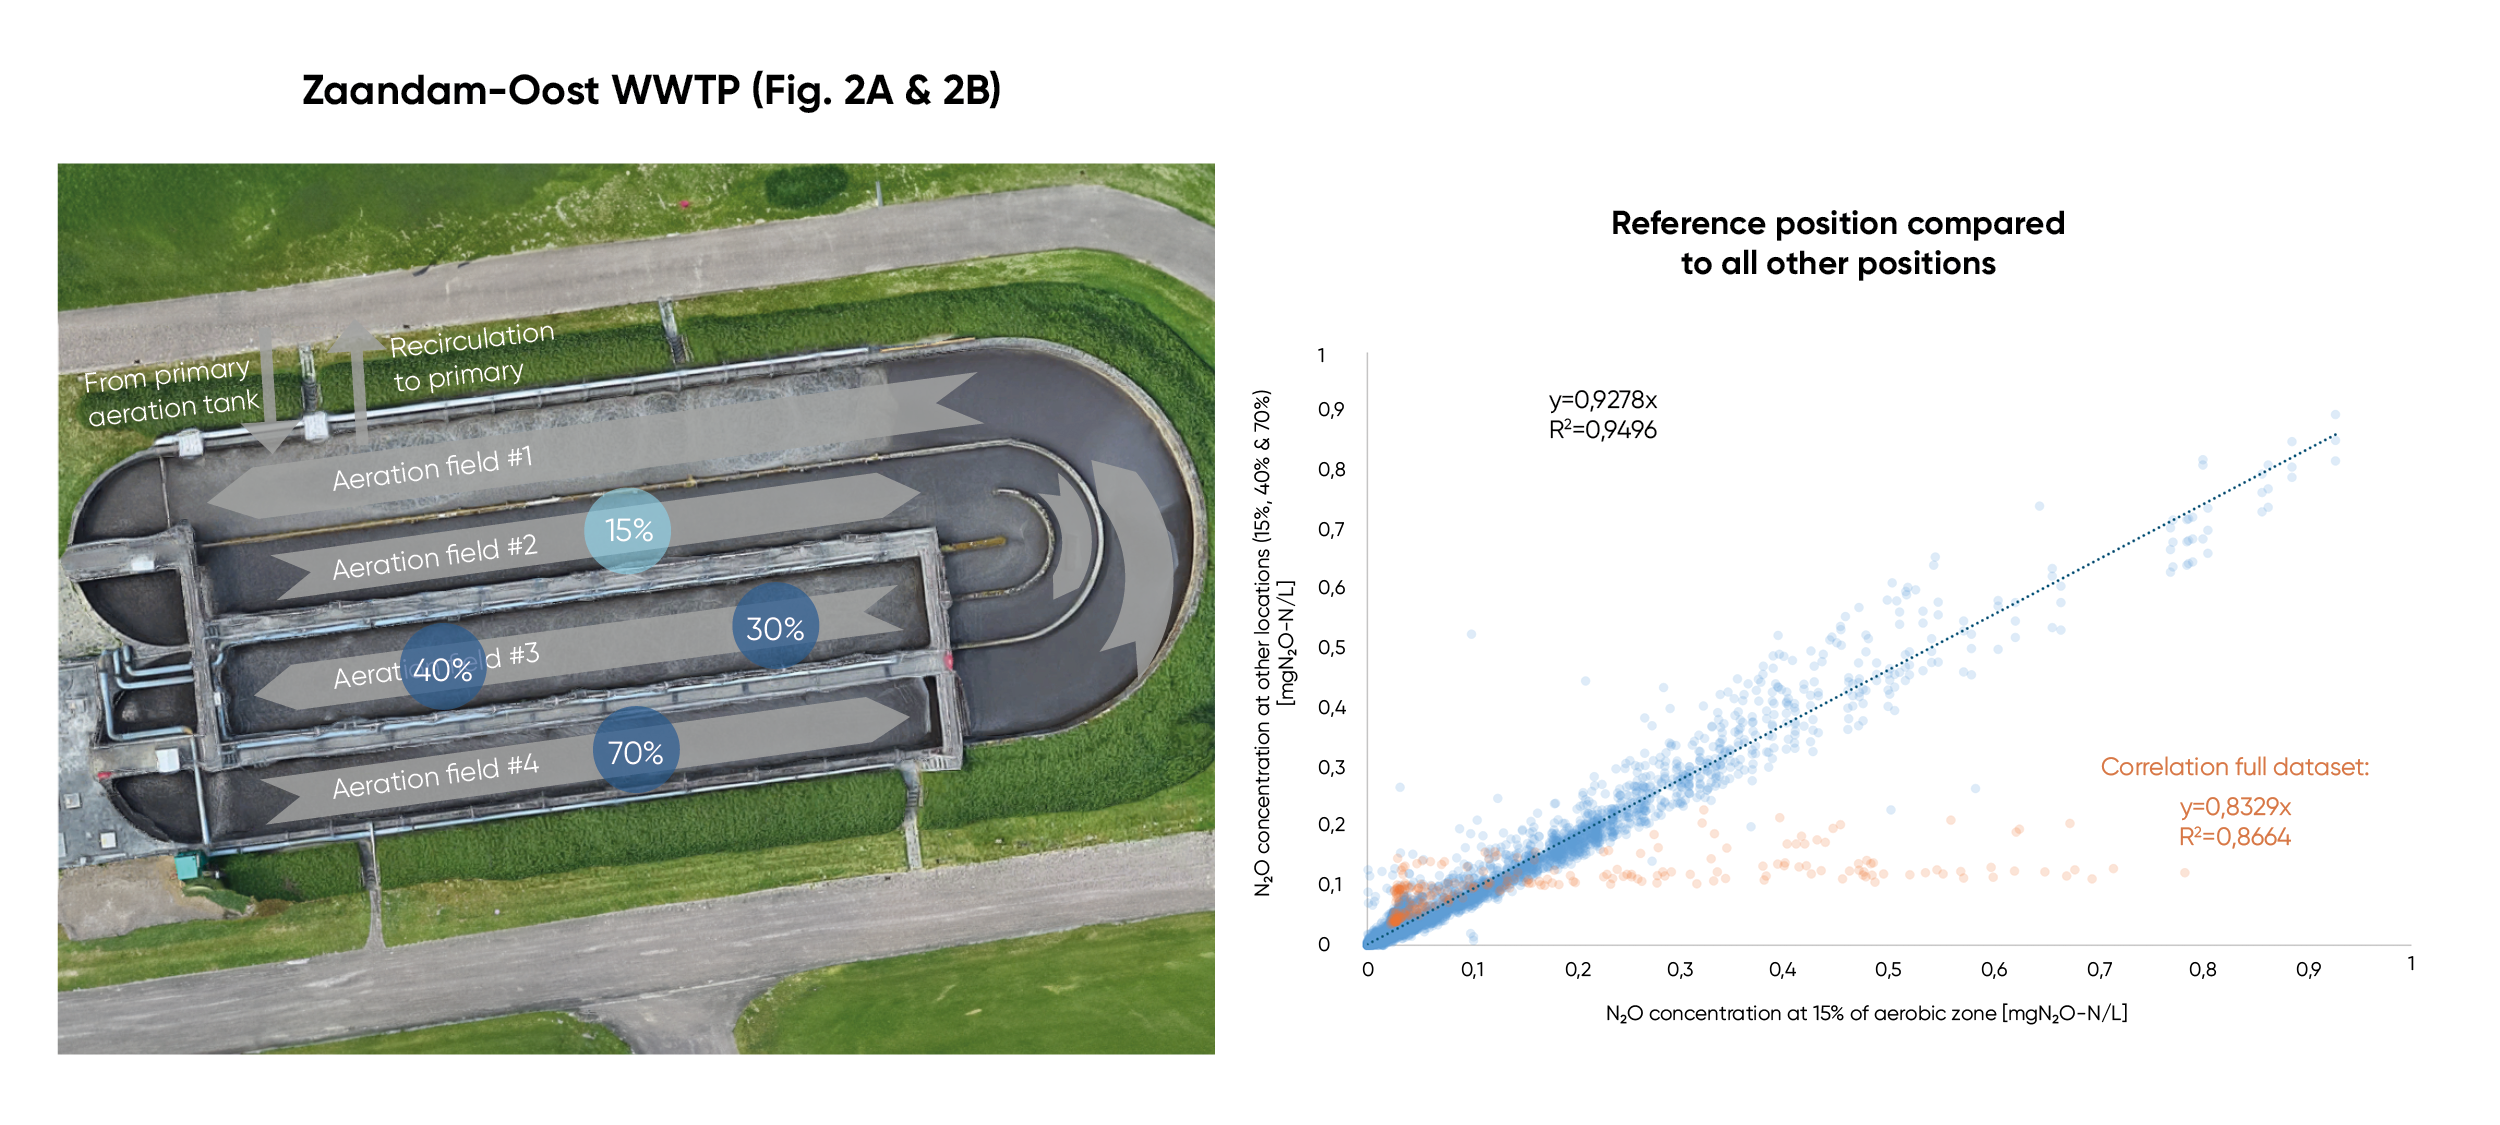
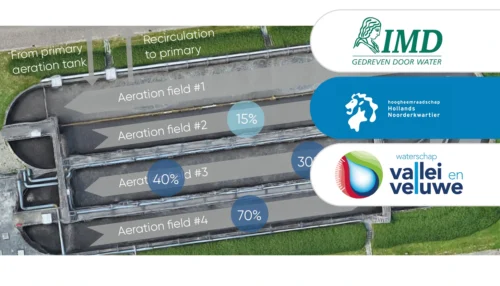
The carrousel reactor in this study is representative of many recirculation reactors with a raceway geometry. It consists of 4 sequential channels with aeration controlled separately by NH4 setpoints. Dissolved N2O concentrations were measured with Unisense Environment N2O Wastewater Sensors, which remained in each position between 15 and 111 days. See Figure 1A and 2A for the flow pattern and measurement locations in both reactors.
The goal of this study was to investigate spatial concentration differences along the flow direction and determine the most representative positions for long term monitoring with the purpose of emission determination and process understanding.
Fig 1A & 2A: Measurement locations and comparison of N2O concentrations. Flow direction is shown by arrows, measurement position by colored dots. % gives the position within the whole length of the respective zone. Blue: aerobic zone. Light blue: reference sensor. Green: anoxic zone.
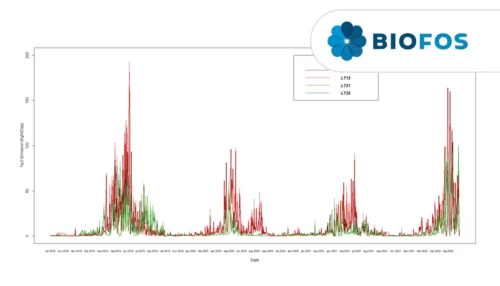
Fig 1B & 2B: Hourly average N2O concentrations measured in the aerobic zones of the reactors. Comparison between the reference sensor position with all other locations is shown. Each position was monitored for 15-111 days. Linear correlation is shown as dotted line and formula. Orange cluster in 2B represents a 10-day event excluded from the correlation (see discussion).
Results and discussion
The measurement campaign showed that in the aerated zones, despite a large range of measured concentrations and different oxygen levels, there was no significant difference between the positions tested. This pattern was observed over a total period of 111 days and is illustrated in figure 1B and 2B. These show the direct comparison of the N2O value at a single location (50% and 30% respectively) with all other positions in the same reactor. The linearity and correlations are very strong, with a slope as well as R2 value close to 1 and the intercept close to zero, indicating the near equality of the concentration values measured at the different locations. A value of 1 in R2 value would be a perfect match between values.
The orange-marked cluster in figure 2B are elevated values that were registered during a 10-day period at the position 15%, close to the influent of the reactor. Operators were not able to identify a specific technical cause for this. However, just before the period, there was a short-term change in influent configuration, resulting in unsettled sewage entering close to position 70%. It can be speculated that this upset of the process has caused the later local increase in N2O. Due to the delimited nature of the event, the data cluster was removed from the correlation analysis. The data with the cluster included is shown in figure 2B.
In the anoxic zone a different pattern was observed, as could be expected. Depending on process conditions, this zone can be either a source or a sink of N2O. The different positions along the zone showed marked differences in concentration. Differences also varied over time representing changes between net production or net consumption of N2O over the whole zone.
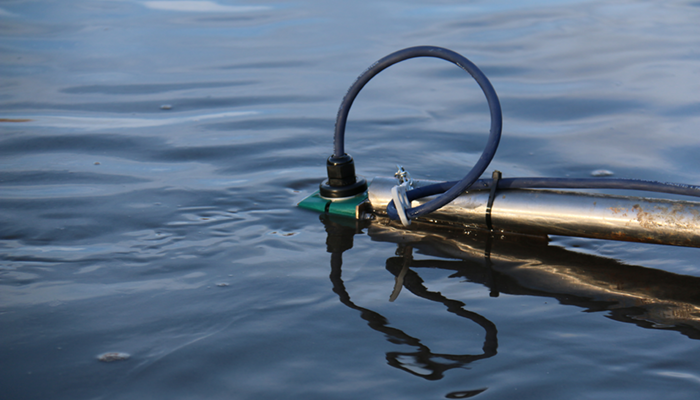
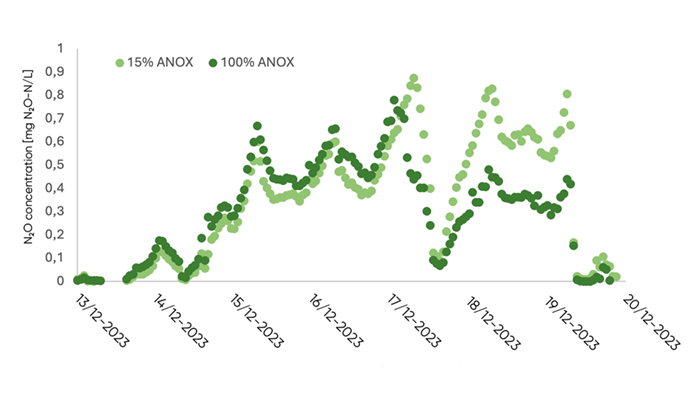
Figure 3 shows a comparison of two measurement locations over the course of one week. The data is taken from 15% and 100% of the whole anoxic zone length, representing the beginning and the end of the zone.
During the first days, both locations had similar low concentrations. After that there was a period of slightly higher concentrations at 100%, speaking for net production throughout the zone. From 17.12. onward, higher concentrations in the beginning of the zone were measured, indicating a net consumption of N2O. After this, values in both locations were similar again. These trends show the dynamic nature of bacterial processes in the anoxic zone, which can act as both a source and a sink of greenhouse gas.
To get a full understanding of these dynamics, two locations in the anoxic zone should be monitored continuously. To understand the net effect of this zone in terms of emissions risk, a single measurement location at the end of the zone is ideal, as here the water passes back to the aeration where stripping takes place.
Two liquid phase N2O sensors accurately represent process dynamics and emissions in most common raceway and recirculation reactors.
Learn how Kerteminde Forsyning applied nitrous oxide data to reduce the formation of N2O while maintaining low nitrogen emissions
Case Study: Full-scale comparison of N2O emissions determined by liquid sensors and off-gas measurement
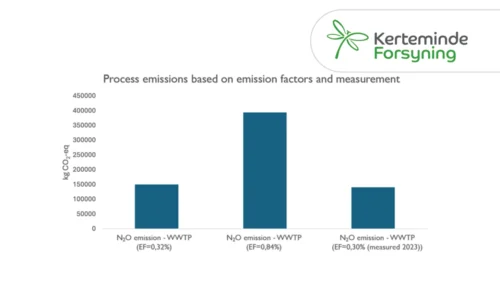
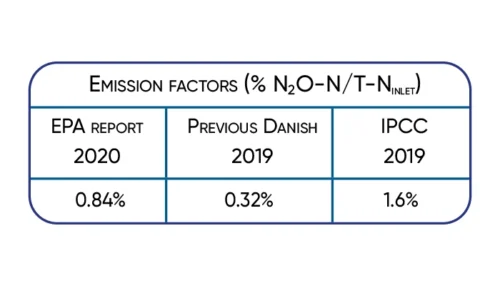
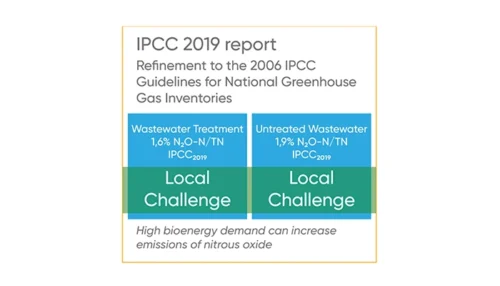
Significant 3-fold increase in IPCC2019 wastewater N2O emission factor supported by Danish studies.
A case study from Kralingseveer WWTP in the Netherlands explores the influence of sensor placement.
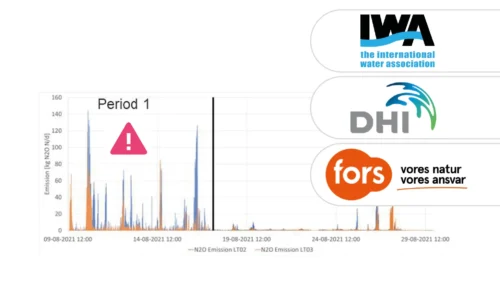
Based on data from Danish WWTPs through advanced online-control.
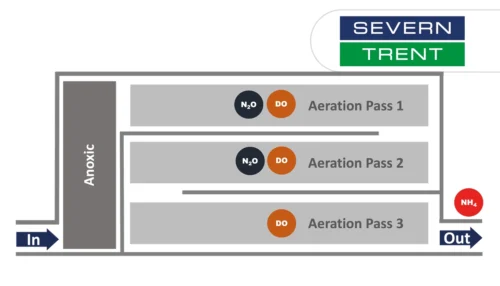
Learn about the results from N2O monitoring in the activated sludge tanks at Severn Trent’s Spernal sewage treatment plant
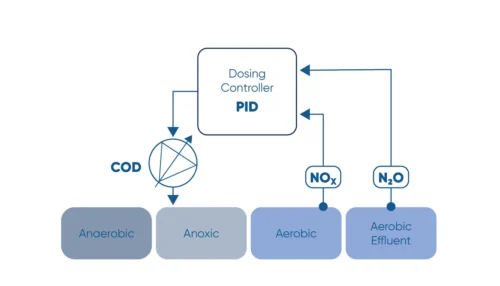
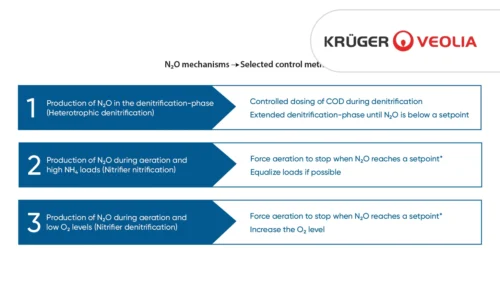
Monitor the N2O concentration in the liquid and use N2O as a control parameter for carbon dosage in the denitrification process.
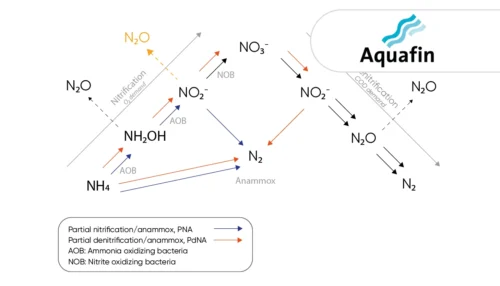
Learn how the water utility Aquafin controls emissions from deammonification processes using the the N2O Wastewater Sensor

Greenhouse gas emissions at wastewater treatment plants are coming into focus as the water industry works to reduce its climate footprint

The investment costs had initially deterred us somewhat. However ...
A study of three very different WWTPs in Denmark: Bjergmarken (125,000 PE), Holbæk (60,000 PE), and Hvalsø (11,570 PE)
The available data show that the nitrous oxide emission varies in time and between wastewater treatment plants.
Information regarding N2O emissions from trickling filters is limited, partly caused by the difficulties in capturing off-gases.
Significant 3-fold increase in IPCC2019 wastewater N2O emission factor supported by Danish studies.