
Read the full report (published April 2025) from the Danish Environmental Protection Agency here: AWAIRE Development and testing of techniques for measuring N2O emissions from wastewater treatment plants
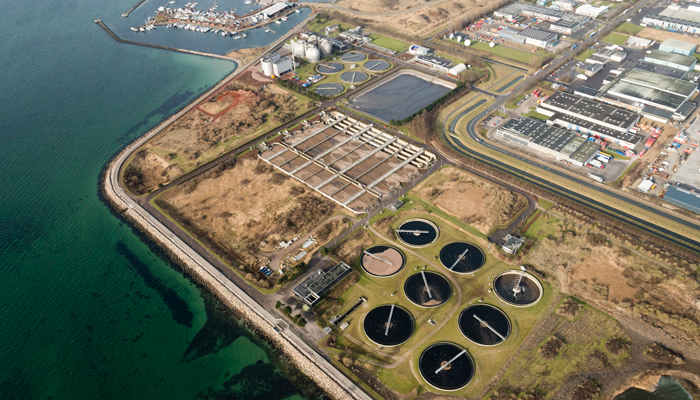
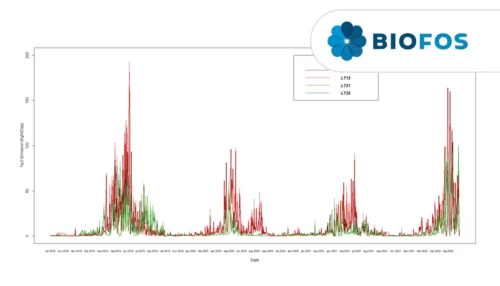
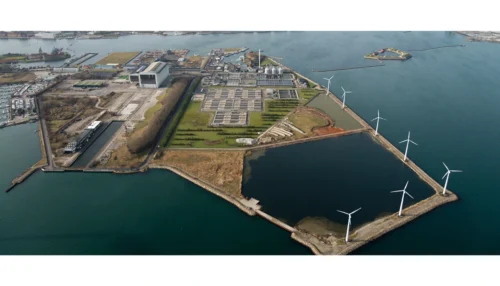
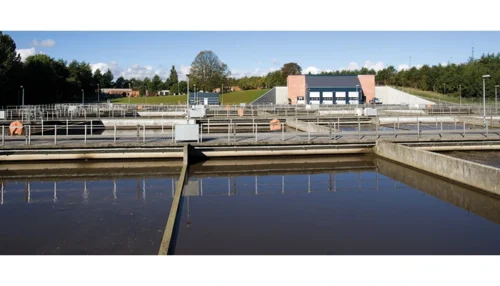
The AWAIRE project validates Unisense Environment’s full-scale emission measurements against accredited drone flux measurements and the tracer gas dispersion method which is also used for methane leak emissions. The measurements have been carried out in 4 out of 8 process tanks at the BIOFOS Avedøre water resource recovery facility.
The report builds on more than 400 measurements made over a period of 2 years.
The AWAIRE monitoring is made on the same plant as the VARGA project (from wastewater treatment plant to water resource recovery facility): Direct Effect of Activated Sludge Concentration on N2O Emission and CO2-equivalents at Full-scale
All references (in-text) to specific methods, comparisons, and results are drawn from the AWAIRE Report.
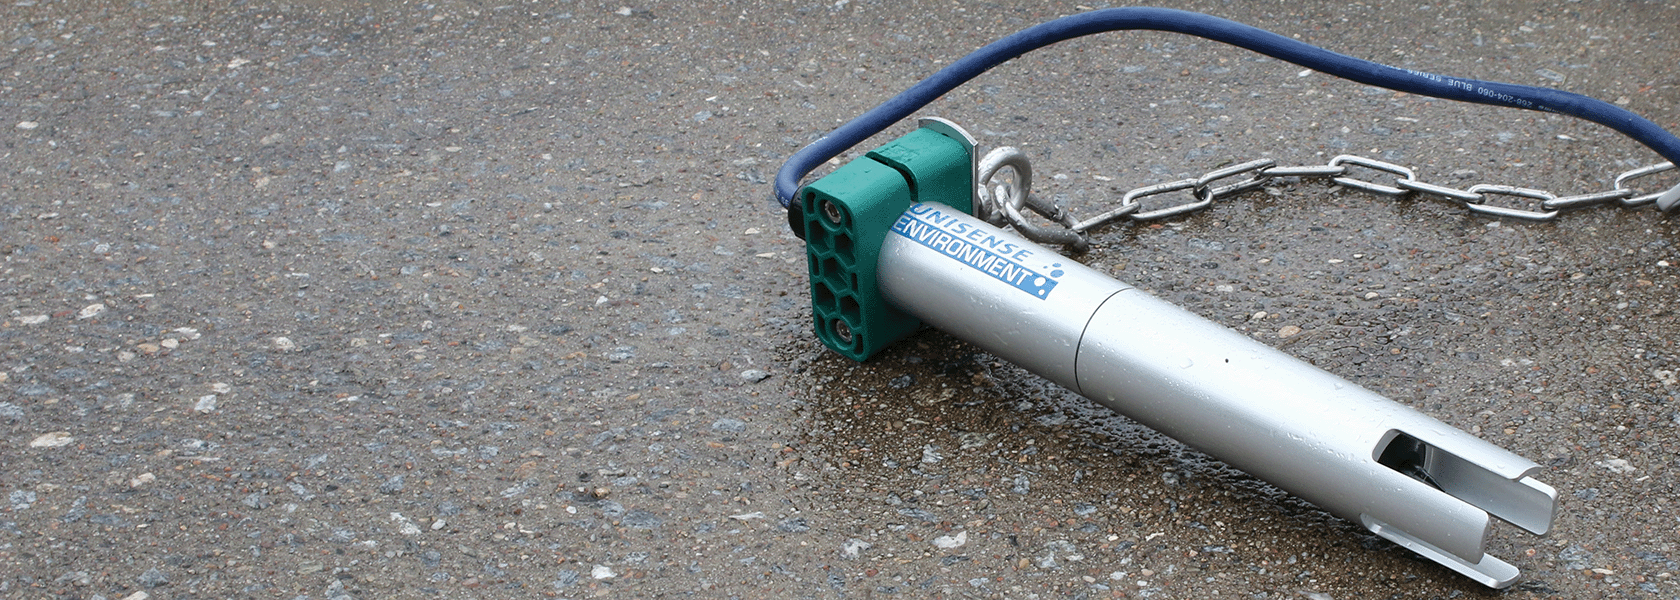
Liquid Phase Sensors: Real-Time Process Insight
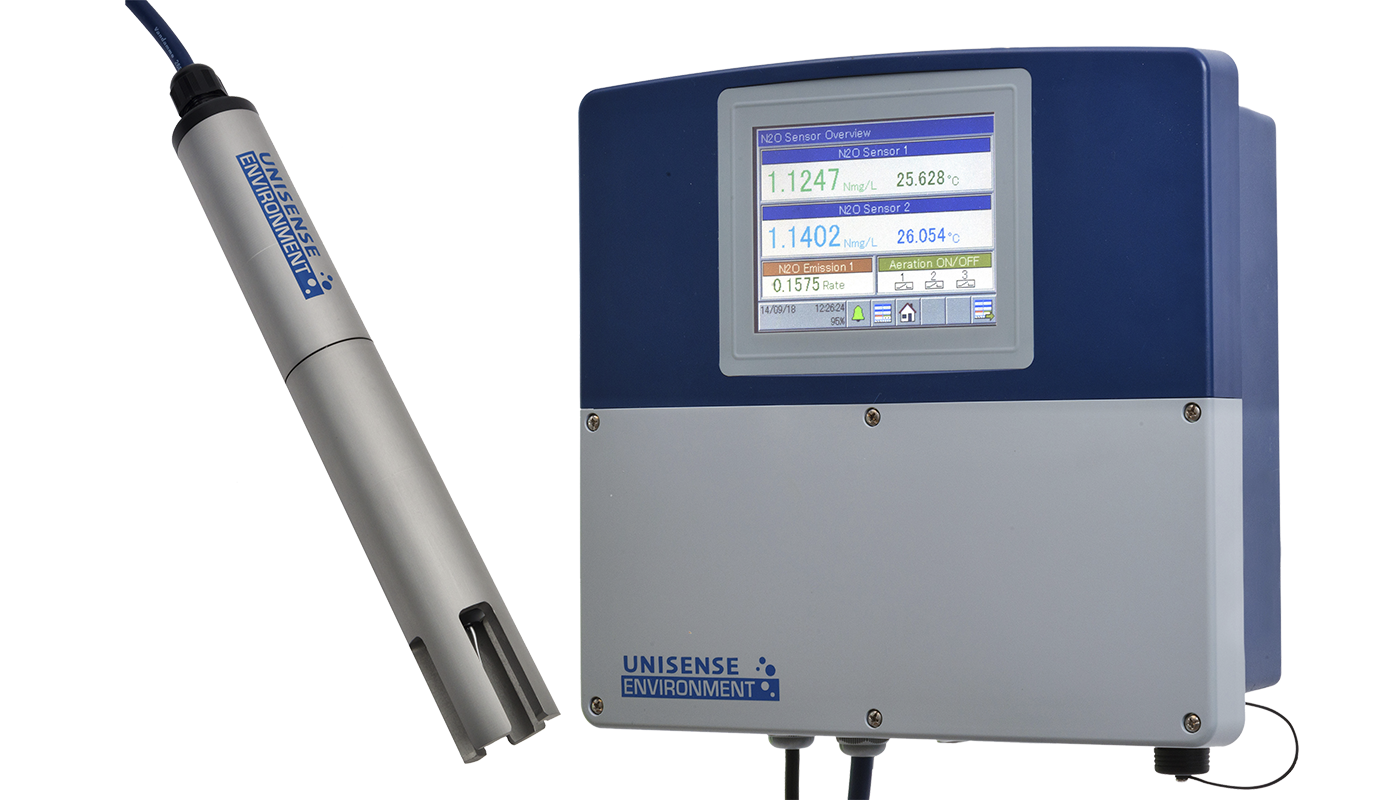
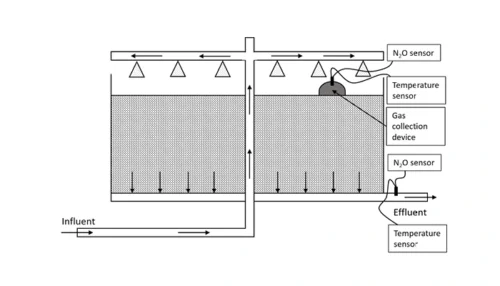
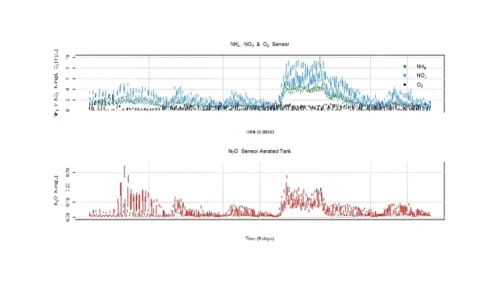
The Unisense Environment sensors were a central element of the AWAIRE project. Installed directly in the biological treatment lines, our sensors continuously monitor N2O concentrations in the liquid phase. When combined with data such as airflow, temperature, and tank volume, LPS outputs can be used to calculate plant-wide N2O emissions (Section 6.2).
During the project, LPS outputs were refined and integrated into Veolia’s Hubgrade Performance Plant system. Sensor drift was corrected, and sensor placement was optimized to ensure representative readings across tanks (Section 9.2.2).
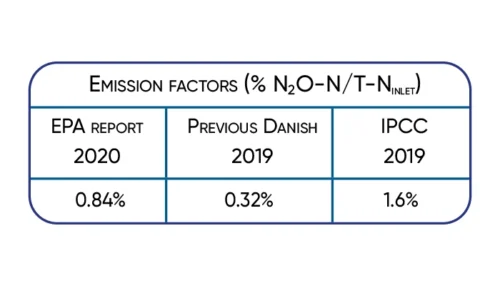
Emission Factors and Regulatory Implications
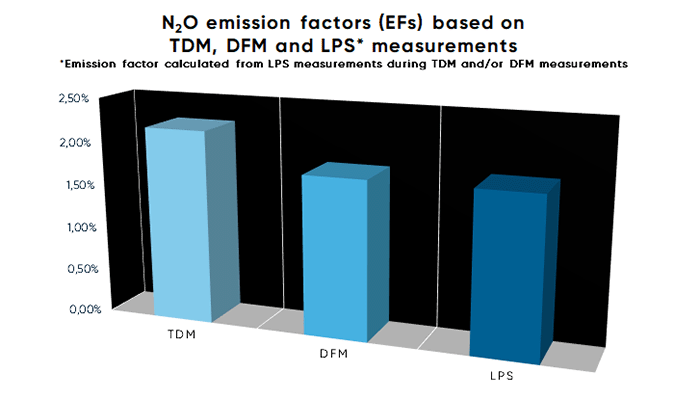
The project also assessed N2O emission factors—defined as the percentage of influent nitrogen converted to N2O:
- DFM: 1.8%
- TDM: 2.2%
- LPS: 1.8% on the same measurement days (Section 10)
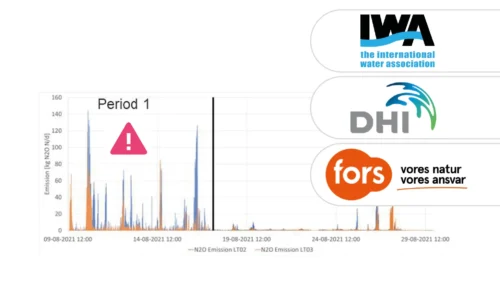
These figures confirm the reliability of LPS-based emissions calculations and support their use in regulatory compliance and climate reporting. The high variability of emissions further emphasizes the importance of continuous monitoring (Sections 9.3 and 12).
Tech Notes and References
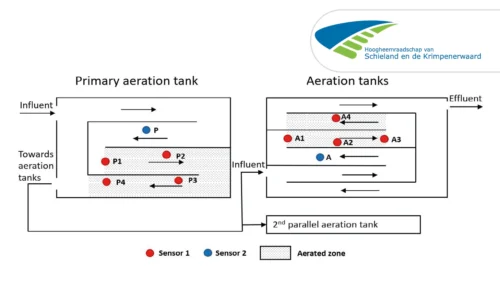
Two liquid phase N2O sensors accurately represent process dynamics and emissions in most common raceway and recirculation reactors.
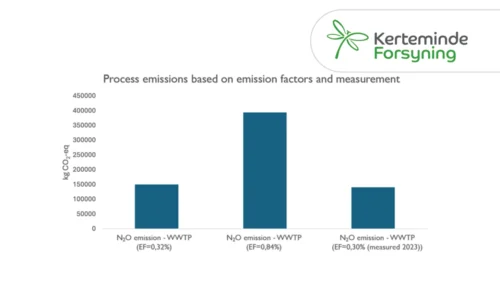
Learn how Kerteminde Forsyning applied nitrous oxide data to reduce the formation of N2O while maintaining low nitrogen emissions
Case Study: Full-scale comparison of N2O emissions determined by liquid sensors and off-gas measurement
Significant 3-fold increase in IPCC2019 wastewater N2O emission factor supported by Danish studies.
A case study from Kralingseveer WWTP in the Netherlands explores the influence of sensor placement.
Based on data from Danish WWTPs through advanced online-control.
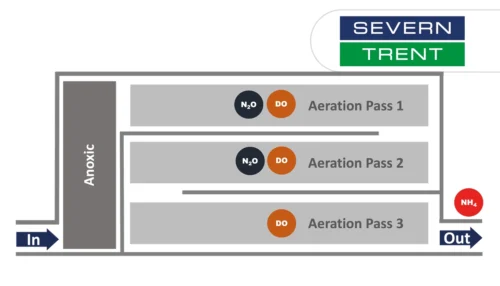
Learn about the results from N2O monitoring in the activated sludge tanks at Severn Trent’s Spernal sewage treatment plant
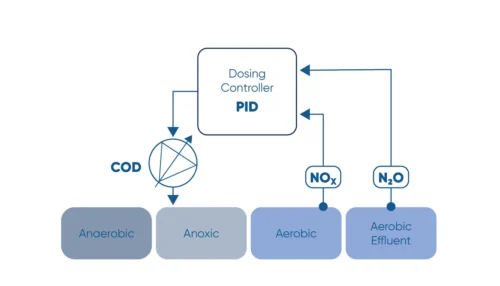
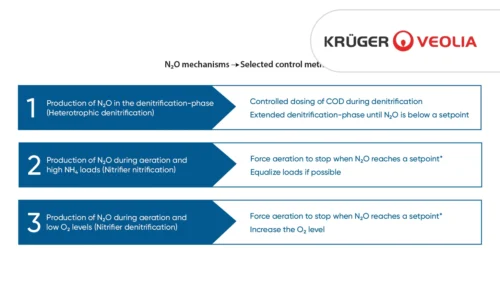
Monitor the N2O concentration in the liquid and use N2O as a control parameter for carbon dosage in the denitrification process.
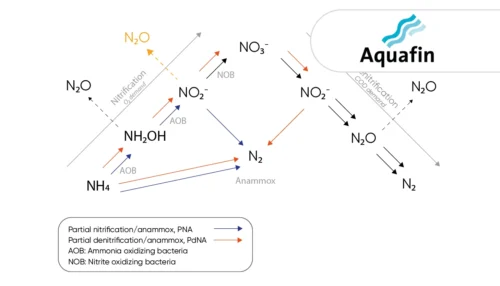
Learn how the water utility Aquafin controls emissions from deammonification processes using the the N2O Wastewater Sensor
Greenhouse gas emissions at wastewater treatment plants are coming into focus as the water industry works to reduce its climate footprint
The investment costs had initially deterred us somewhat. However ...
A study of three very different WWTPs in Denmark: Bjergmarken (125,000 PE), Holbæk (60,000 PE), and Hvalsø (11,570 PE)
The available data show that the nitrous oxide emission varies in time and between wastewater treatment plants.
Information regarding N2O emissions from trickling filters is limited, partly caused by the difficulties in capturing off-gases.
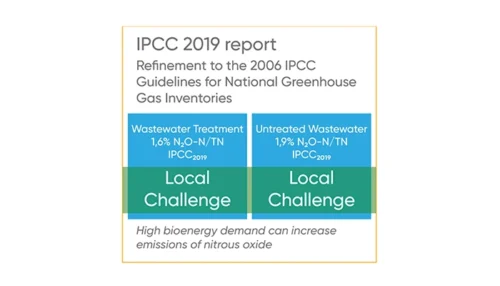
Significant 3-fold increase in IPCC2019 wastewater N2O emission factor supported by Danish studies.
VCS Denmark, one of the largest and oldest water and wastewater companies in Denmark, is actively committed to resource optimization
Frederikshavn Water Utility contacted Unisense Environment for assistance in determining the actual N2O derived CO2 footprint
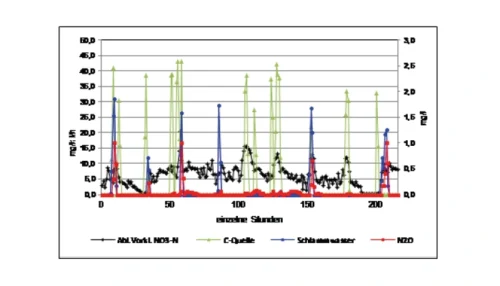
WWTP Pforzheim uses an N2O sensor to determine the formation rate of nitrous oxide in the denitrification and the nitrification zone